- 아태 지역 생성형 AI 투자, 2028년까지 연평균 59.2% 성장
- Secure the network with Cisco AI Defense and Cisco U.
- Google's AI Mode may be the upgrade Search desperately needs - how to try it for free
- 8 ways I use Microsoft's Copilot Vision AI to save time on my phone and PC
- 6 ways AI can help you ace finals - for free (without plagiarizing)

Rate limit Management and Troubleshooting with the new Meraki “API Analytics Dashboard”

Ever hit an API rate limit unexpectedly? Or struggled to track which integrations are consuming the most API calls? We know that feeling—API troubleshooting can be frustrating when there’s little visibility into what’s happening behind the scenes. Without clear insights, it’s easy to run into performance issues, unexpected failures, and rate limit hits that slow down automation and network management.
That’s why we are excited to introduce the Meraki API Analytics Dashboard—a new API visualization tool designed to give better control and visibility into your API usage. Whether you’re fine-tuning an integration, monitoring API calls, or managing API rate limits, this dashboard brings powerful insights to help you work smarter. Let’s dive into what this means for you.
Why API Visibility Matters
APIs are the foundation of automation in modern networking, but without proper monitoring, they can feel like a black box. Here are some common challenges we’ve seen developers and IT teams face:
- Unclear API Usage Trends – Are my API calls increasing over time? What’s driving the load?
- Hitting Rate Limits Unexpectedly – Which parts of my integration are consuming the most calls?
- Difficult API Troubleshooting – How do I quickly identify and fix API errors?
With the new API Analytics dashboard, you finally have the data-driven insights needed to answer these questions—without manually digging through logs.
How the API Analytics Dashboard Helps
The API Analytics dashboard is designed to simplify API rate limit management, troubleshooting, and performance tracking. Here’s what I love about it:
Quick Overview Summary Cards
At a glance, you can see key API usage metrics—total requests, success, errors, and rate limit status—all in one place. No more guessing!
Visualization for API Usage Trends
A clean, intuitive graph helps you track API consumption over time. This makes it easier to spot spikes in usage, identify patterns, and optimize integrations before they become a problem.
Top Usage Metrics Breakdown
Now, you can see exactly which API endpoints are driving the most traffic. The Metrics section provides detailed insights across several key dimensions:
- Applications – Custom scripts, third-party integrations, or partner applications consuming API calls.
- Operations – Specific API actions being executed, giving visibility into which endpoints are used most.
- Admins – The API keys tied to different administrators, helping track usage at an individual level.
- Source IPs – The origin IP addresses making API requests, useful for spotting unusual activity.
Each tab summarizes Total API requests and their relative share of usage, Success vs. error rates for performance tracking and Success rate status icons that highlight areas needing attention. This is invaluable for troubleshooting performance issues and optimizing API call efficiency.
Downloadable API Request Logs
Need deeper analysis? You can export detailed request logs in CSV format, making it easy to share insights with your team or dig into the data further.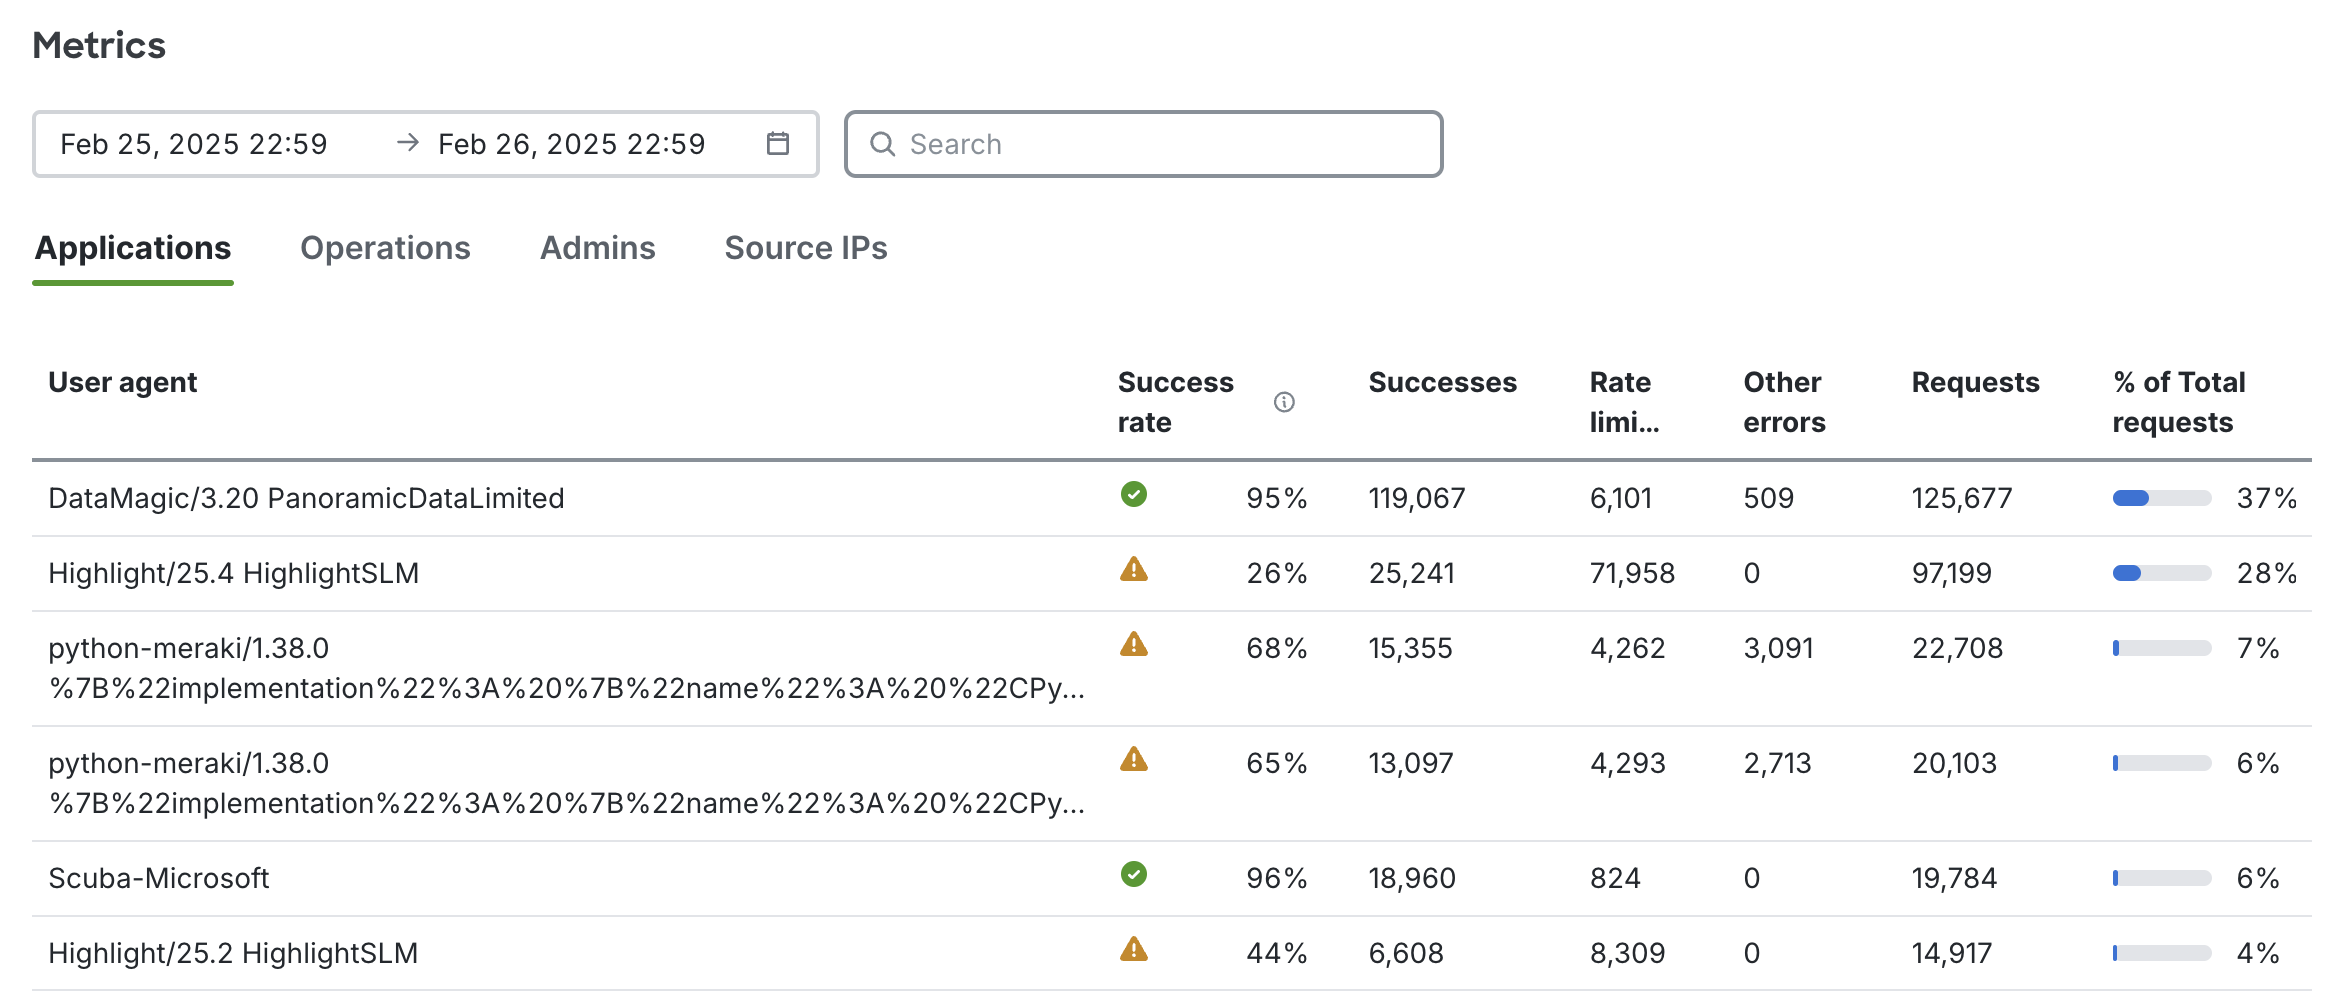
Here’s how this dashboard is already making a difference in my workflow
- By tracking high-usage endpoints, I can optimize my requests and avoid hitting rate limits.
- With real-time insights, I can quickly pinpoint API failures and errors without sifting through endless logs.
- Seeing my API usage trends helps me fine-tune integrations and eliminate unnecessary calls.
Where to Find the API Analytics page
You can find it in your Meraki Dashboard under:
Organization > API & Webhooks
This feature is now available, and I highly recommend checking it out to take control of your API consumption. For more tips on API rate limit management, check out our detailed guide on optimizing API calls for your organization.
Got questions or feedback? Drop a comment below or engage with our community! We would love to hear about how the dashboard is helping you optimize your workflows.
Share:
