- IBM Cloud stumbles again: second major outage in two weeks
- I replaced my Samsung S25 Ultra with the Edge model for two weeks - here's my buying advice
- This $12 USB-C accessory has saved me hundreds of dollars in repairs
- The 7 hottest jobs in IT
- VEC Attacks Alarmingly Effective at Driving Engagement
Secure and Simplify Your Programmable Edge and Industrial Sensors

The Cisco IoT Operations Dashboard provides operations teams with a centralized, cloud-based dashboard to securely deploy, monitor, and troubleshoot device connectivity. Using this secure connectivity as a foundation, that same dashboard then enables you to extract, transform, govern and deliver data from IoT edge devices to the cloud with Cisco Edge Intelligence, install and manage your containerized edge applications and to deploy a broad range of industrial IoT sensors with Cisco Industrial Asset Vision.
Once your solution is in place, or as part of your solution development process, IoT Operations Dashboard enables you to securely and simply access remote connected equipment and to monitor its connectivity status, using nothing more than your browser. This simplifies maintenance, solution development and updates, and ensures business continuity without the need for frequent and costly truck rolls to remote sites and locations.
With IoT Operations Dashboard, scaling up is straightforward. Using the cloud-based dashboard, Cisco Industrial Routers and Gateways can be zero-touch provisioned at remote sites, and automatically configured with proven solution templates and configurations, helping you to streamline configuration of your devices, and reduce errors. You can then deploy your industrial IoT solutions, applications and sensors using that same dashboard. Once in operation, Dashboard provides an Operations Technology (OT) focused user experience and is simple and easy to use. Directly from the browser-based dashboard you can see map-based views of your deployments, equipment status, sensor data, events and alerts, which greatly simplifies monitoring and gaining insights into your operations.
Operations Dashboard offers a rich set of capabilities for developers and systems integrators, as well as custom solutions. And you can start right now on DevNet! The new DevNet IoT Operations Dashboard sandbox includes components such as Edge Device Manager (EDM) and Industrial Asset Vision, and we also offer an IoT Cisco Edge Intelligence (EI) sandbox.
Create templates and test remote access with the Edge Device Manager Sandbox
Custom forms called eCVDs allow you to configure Cisco Industrial Routers and Gateways to meet the exact needs of your solution. Use predefined eCVD configuration forms to leverage Cisco-provided zero-touch provisioning (ZTP) and best security practices. These can then be easily customized using the open-source Freemarker template language on which they are based. This makes it straightforward for you to create a custom configuration form which is specific to your solution with ZTP, security and solution-specific configuration options and in-form guidance.
Using the built-in Secure Equipment Access (SEA) feature of IoT Operations Dashboard, you can then use RDP, VNC, SSH or HTTP/S to securely access remote connected equipment using just the dashboard and your browser. SEA provides this ability for simple and secure remote access even if you are in a different organization and network to your customer’s solution, for example as a solution developer or equipment vendor. This greatly simplifies solution development, especially for those real-world proof-of-concepts and in-field development and update activities that are often so challenging and time consuming.
Reserve our all-new EDM sandbox today for access to a real Cisco IR1101 and your own IoT Operations Dashboard organization! Test on-boarding, deploy applications, and connect via the dashboard to the Linux DevBox without any VPN configuration.

Edge Device Manager – IoT Operations Dashboard Learning Labs
Edge Device Manager – IoT Operations Dashboard Sandbox
Extract all your IoT sensor data via MQTT with Industrial Asset Vision
Cisco Industrial Asset Vision (IAV) provides a complete full-stack solution that includes all hardware and software components, pre-integrated and delivered as a cloud SaaS offer. IAV includes an end-user dashboard application, network management tools, LoRaWAN network devices, and Cisco industrial sensors for collecting environmental and GPS location data.
Cisco IAV exposes APIs through which global independent software vendors (ISVs) and applications developers can integrate with systems such as enterprise resource planning (ERP), service management, manufacturing execution systems, and analytics. Asset and sensor information can also be published to 3rd party data brokers via MQTT and to Azure IoT Hub.
Industrial Asset Vision – IoT Operations Dashboard Documentation
Simplify IoT Edge-to-Multi-Cloud Data Flow with Cisco Edge Intelligence
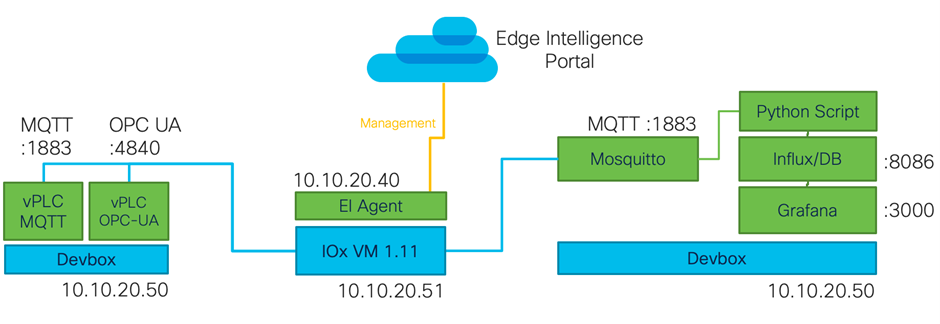
As part of IoT Operations Dashboard, the IoT data orchestration software, Cisco Edge Intelligence, connects assets at the edge to multi-cloud application destinations in a very easy way for the user and can even extend its functionality with a transformation engine at the edge. You can read more in our previous blog, and try it out in our Edge Intelligence DevNet sandbox!

Edge Intelligence – IoT Operations Dashboard Learning Labs
Edge Intelligence – IoT Operations Dashboard Sandbox
Resources
This blog is co-authored by Florian Pachinger
We’d love to hear what you think. Ask a question or leave a comment below.
And stay connected with Cisco DevNet on social!
Twitter @CiscoDevNet | Facebook | LinkedIn
Visit the new Developer Video Channel
Share:

