- Cisco U. Theater: Where Innovation Meets Learning - Cisco Live
- Your Guide to Cisco APIs at Cisco Live 2025: Empowering IT Teams in the DevNet Zone
- Netgear's enterprise ambitions grow with SASE acquisition
- The latest robot vacuum innovation will leave clean freaks drooling (and it's $450 off)
- Jackery's updated portable power station boasts better battery - and a big price cut
Log Insight – AIOps with vRealize (Part 2) – Cloud Blog – VMware

The Challenge with Logs
If you consider your time working with technology, reviewing log files must be one of the most daunting tasks. It certainly is for me, line after line of output messages, that may or may not be readable to a human being, searching for the few words, which hopefully bring clarity to a deployment failure, or a production outage.
For troubleshooting success, you must rely on a few characteristics of those logs to be present:
- Consistent timestamps
- Log Level identification
- Meaningful message body
There are other pieces to the puzzle as well. I skipped the most important one so far, the log must exist for the system or device you are interested in. The settings must be configured correctly, ensuring logging is enabled, the output persists reboots, and rotates.
Once you have all this in place. You are just waiting for the time when you need to review the log. Or rather you are hopeful you never will, a sign the systems are running smoothly.
When the inevitable happens, connect to your system, search for the log file output, and then you begin that long scrolling of the mouse wheel, looking for that key piece of information. If your outage is widespread, you might have to do this over and over across systems, piecing together snippets of errors and clues to find the root cause. This is a manual effort, the clock ticks as your time to resolution increases.
Quite simply, the scale and volume of machine-generated data is increasing exponentially and making sense of it is an overwhelming task.
But as you will have guessed from the title of this blog post, there are options, a smarter way to work. Deploy a log analysis tool and provide a highly scalable log management platform. Centralising all those individual device and system outputs into a tool, which will help to decode and analyse the logs. Choose the right tool, and this will offer intuitive features such as actionable insights, the ability to respond based on the logs receives; deep operational visibility and faster troubleshooting, maybe even anomaly identification for logs that are outside of the observed baseline.
Introducing vRealize Log Insight
The first part in this series introduces the concept of leveraging an AIOps model to improve monitoring, alerting and problem resolution across your platforms and clouds. We described the three pillars essential to every AIOps implementation (Observe, Engage and Act), which we will continue to use as we delve into the capabilities of vRealize Log Insight.
vRealize Log Insight provides intelligent log management for infrastructure and applications in any environment. This highly scalable log management solution delivers intuitive, actionable dashboards, sophisticated analytics, and broad third-party extensibility across physical, virtual, and cloud environments.
Observe
In the observe pillar, we seek to bring context to the vast amount of data you need to deal with across your I.T. platforms. In this case, its logs. We need to be able to visualize and query real-time and historical data. Leveraging machine learning, vRealize Log Insight provides the functionality of grouping together similar events. Intelligent Grouping scans incoming data and quickly groups messages together by problem type, enabling high performance searches for faster troubleshooting and root cause analysis.
These groupings are displayed as Event Types, and each new type discovered, is represented by a smart field. Types can be timestamps, strings, int, hex and others.
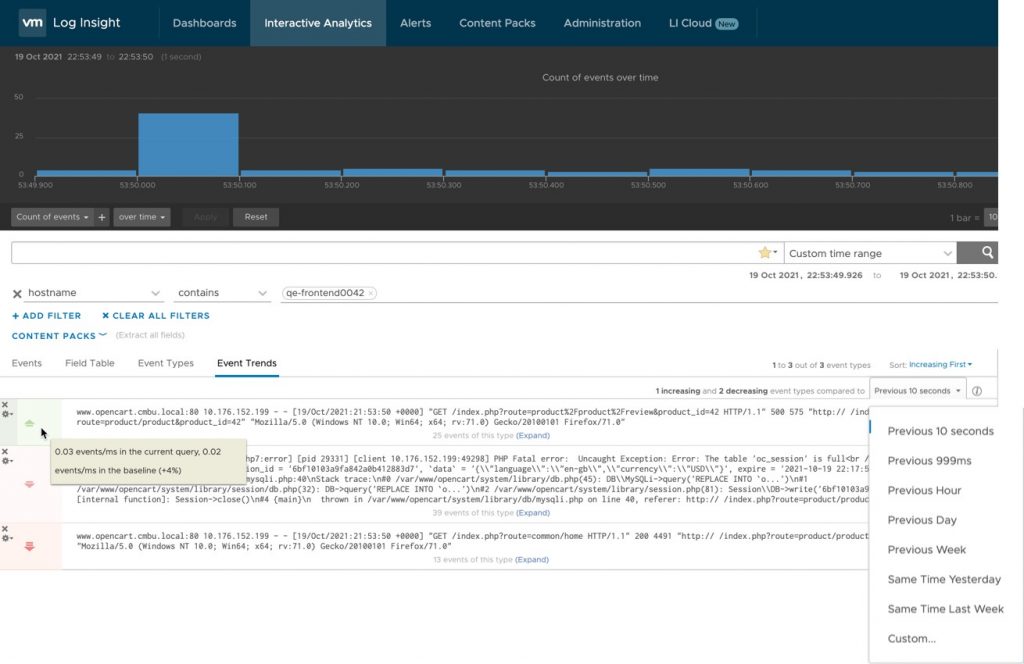
Using the Event Trends page, you can visualise the event types and trend them against a baseline of number of received logs over a specified time frame
In the below example, I filtered the application logs from a deployed virtual machine in our environment, set a custom time range. And now I can see three distinct Event types, two of which have been decreasing, and one that is increasing.
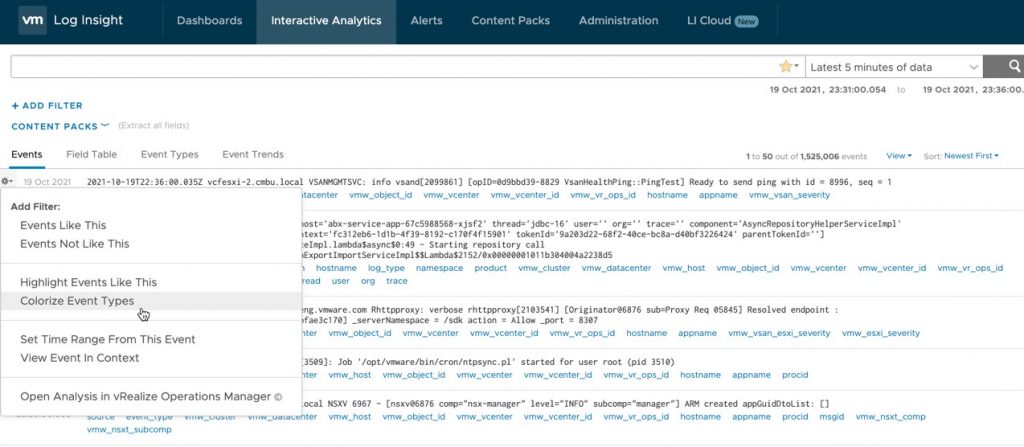
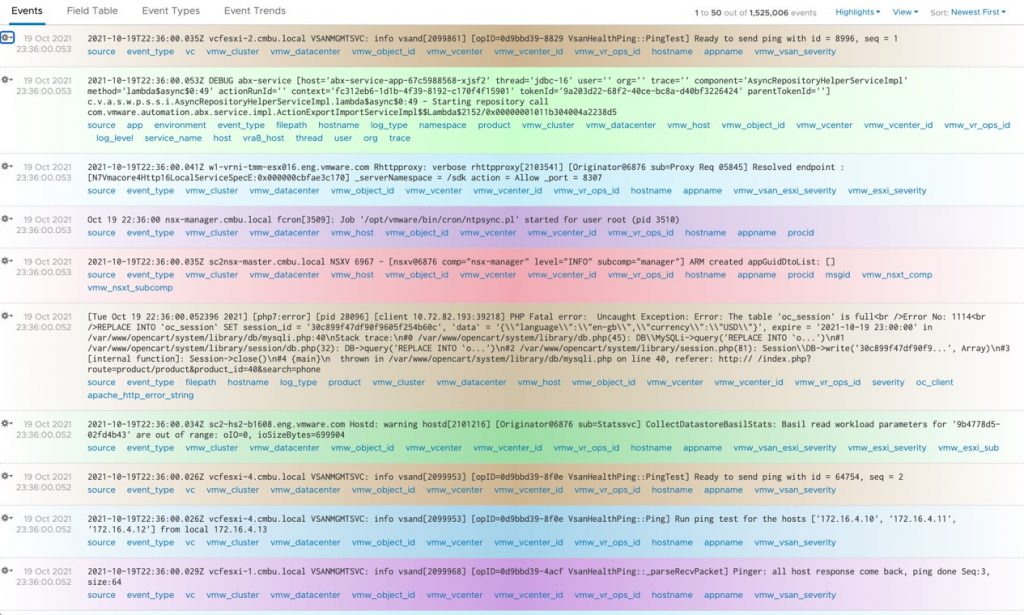
From here, you can select any event or log you are interested in, and either highlight other similar logs returned as you scan through the output, or simply have all the events colorized for you. Visually you start to see patterns and target the areas you are interested in, building up a view of logs from disparate sources together in the same query.
vRealize Log Insight gives you the flexibly to ingest logs from all the devices and deployments in your IT platform. Providing you full visibility of your platform through the ability to analyze unstructured or structured log data. vRealize Log Insight accepts data from the following sources: Syslog, Log Insight Agent, REST API, existing archives, and vSphere log parser.
Engage
Now that you can visualise and query your logs effectively through this pillar of observation, we want to start embedding value further into the overall platform and business. This means we need to integrate with other technologies. Log Insight achieves this in several ways:
- We have already started to cover some UI features to bring clarity to the unstructured log data. Continuing, vRealize Log Insight is built to be API first, the same queries you run in your browser can be performed by API calls, allowing easy integration into your own systems.
- Content packs. These are developed and available from VMware and also our technology partners, which allow you to import pre-built dashboards and queries, to quickly deliver time to value for your log data sources.
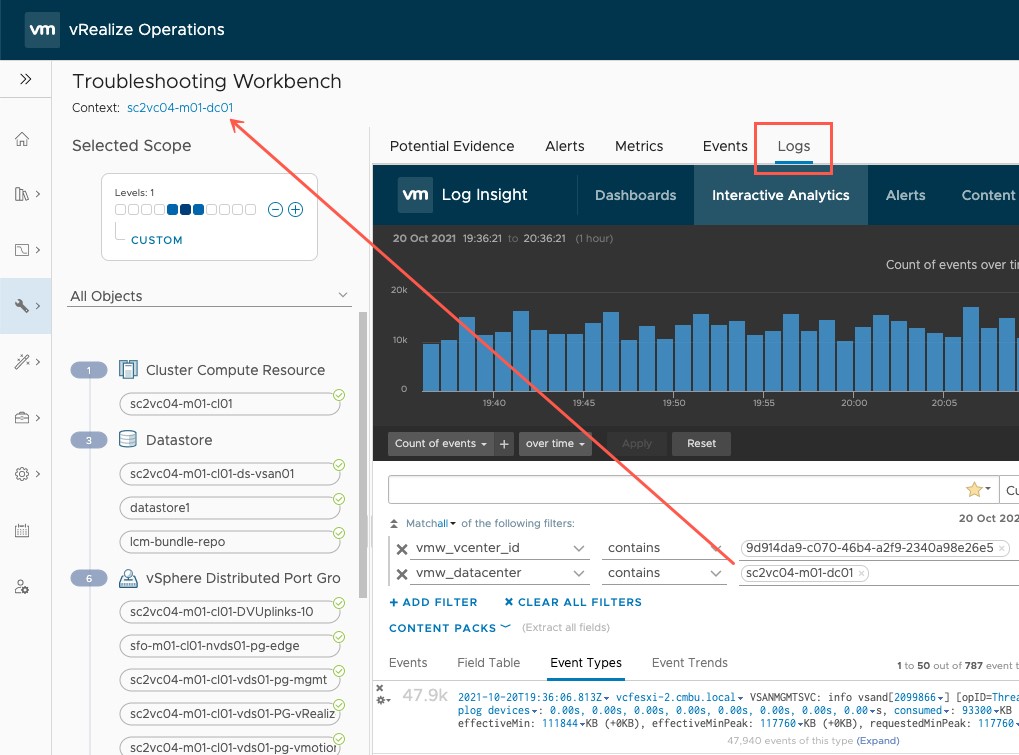
- Integration with vRealize Operations. This extends the operational visibility and proactive management capabilities beyond logs, across infrastructure, applications and cloud services too. Combining the two technologies gives you visibility of log events in context, alongside metrics, and other areas of vRealize Operations such as Troubleshooting Workbench, Alerts, and Reports.
Act
Now that we can visualise the logs effectively, with context, and we have started to embed the technology further into the business, we need to be able to act quickly to deal with any issues we see, or ideally avoid any issues in the first place.
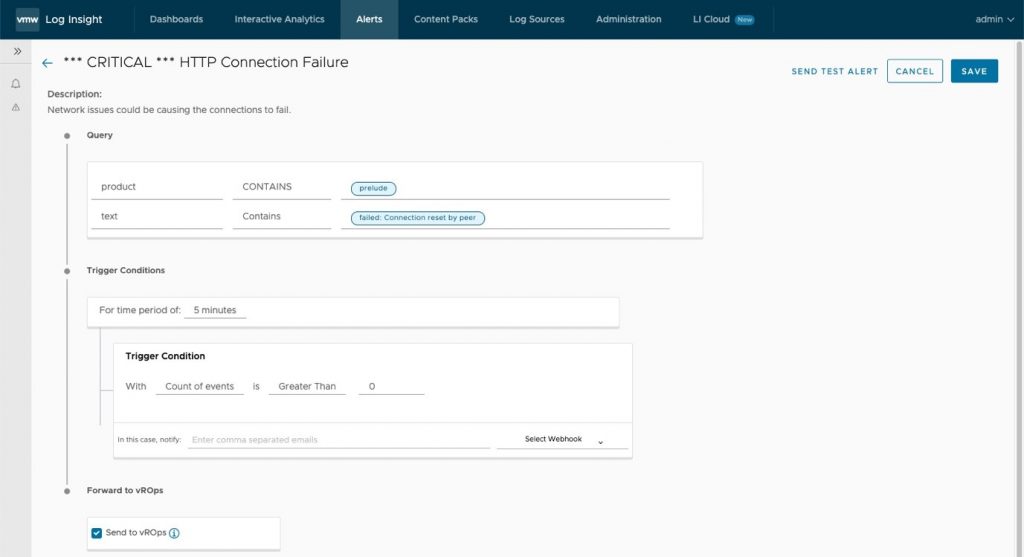
vRealize Log Insight provides the ability to define alerting criteria, based on query matching and thresholds. When these are exceeded, triggers can be to send emails, webhook notifications or trigger notification events in vRealize Operations. Alerts may also be imported via content packs, for example the vRealize Automation Content Pack shown below.
Summing Up
Log Insight is an intelligent platform which fits well into an AIOps approach, it provides intelligent log management in a highly scalable architecture, with a rich marketplace of content and strong APIs to ensure you can quickly act on issues and improve the overall up time of your cloud platforms.
Check back soon for part 3, where we will be talking about leveraging vRealize Operations in your AIOps approach, for increased productivity, cost savings and business acceleration!
This post was co-authored with Dean Lewis, Senior Solution Engineer, VMware UK. Please check out Dean’s personal blog vEducate.co.uk or reach him on twitter @saintdle.


