Building a Custom SecureX Orchestration Workflow for Umbrella – Cisco Blogs

Improving efficiency for the Cisco team in the Black Hat USA NOC
As a proud partner of the Black Hat USA NOC, Cisco deployed multiple technologies along with the other Black Hat NOC partners to build a stable and secure network for the conference. We used Cisco Secure Malware Analytics to analyze files and monitor any potential PII leaks. We also used Meraki SM to manage over 300 iPads used around the venue for registration, as well as sales lead generation. Last but not least, we used Umbrella to add DNS level visibility, threat intelligence and protection to the entire network.
Lets go over an example scenario which many customers may find themselves in. While we were in the Black Hat USA NOC (check out this blog about Cisco Secure in the NOC), we were constantly keeping our eyes on the Umbrella security activity report, in order to recognize, investigate and work with other teams to respond to the threats.
Continuously monitoring the activity report can be taxing, especially in our case with two Umbrella organizations – one for the conference iPad deployment and another for the conference attendee network. In comes SecureX to help make our lives simpler. Using SecureX orchestration we were able to import a pre-built Umbrella workflow and easily customize it to suite our needs. This workflow pulls the activity report for a configurable list of categories, creates an incident in SecureX, notifies the team in Webex Teams and updates a SecureX dashboard tile. Let’s jump into SecureX orchestration and take a look at the workflow.
A plethora of SecureX orchestration content is available on our GitHub repo to help you find value in our automation engine in no time. At the link above, you’ll find fully built workflows, as well as building blocks to craft your own use cases. Here is what the 0023 Umbrella: Excessive Requests To Incidents workflow looks like upon importing it (shoutout to @mavander for authoring the workflow).

You can see in the variable section there are four variables, three strings and one integer. “Categories to Alert On” is a comma separated list of categories we want to be notified about, which makes it very easy to add or remove categories on the fly. In our case, we want to be notified if there is even one DNS request for any of the Security Categories, which is why we have set the “request threshold” to one.

Now that our variables are set, let’s dig into the first web service call that is made to the Umbrella API. Umbrella has three API’s:
- The management API
- The Investigate API
- The reporting API (which is the one we need to use to pull the activity report)
There are often minute differences when authenticating to various API’s, but luckily for us, authenticating to the Umbrella API is built into the workflow. It’s as simple as copying and pasting an API key from Umbrella into orchestration and that its. You’ll notice the Umbrella API key and secret are stored as ‘Account Keys’ in orchestration this way you can reuse the same credentials in other workflows or other API calls to Umbrella.


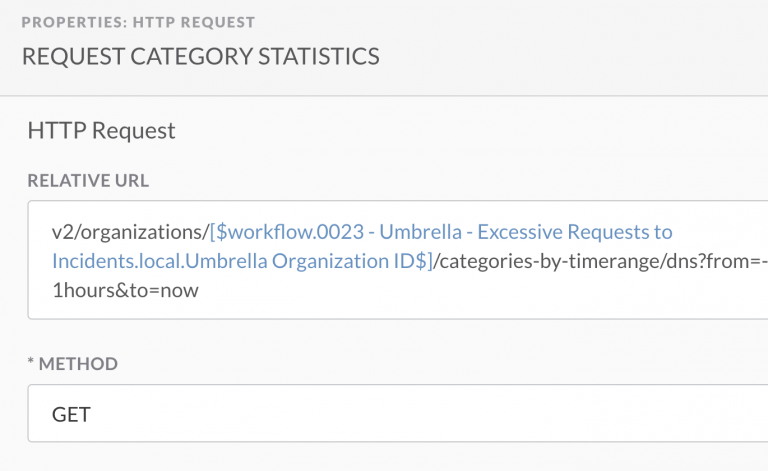
In this case, we are dynamically crafting the URL of /v2/organizations/<umbrella_org_id>/categories-by-timerange/dns?from=-1hours&to=now by using the Umbrella org ID from the variables above. Notice the API call is going to GET an activity report for the past hour, but it could be modified to be more or less frequently.

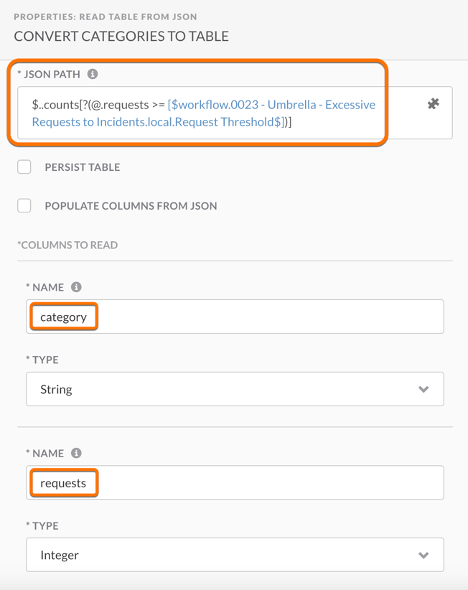
Now that we have a JSON formatted version of the activity report, we can use JSON path query to parse the report and construct a table with the category names and the number of requests. Using this dictionary, we can easily determine if Umbrella has seen one or more requests for a category which we want to alert on.

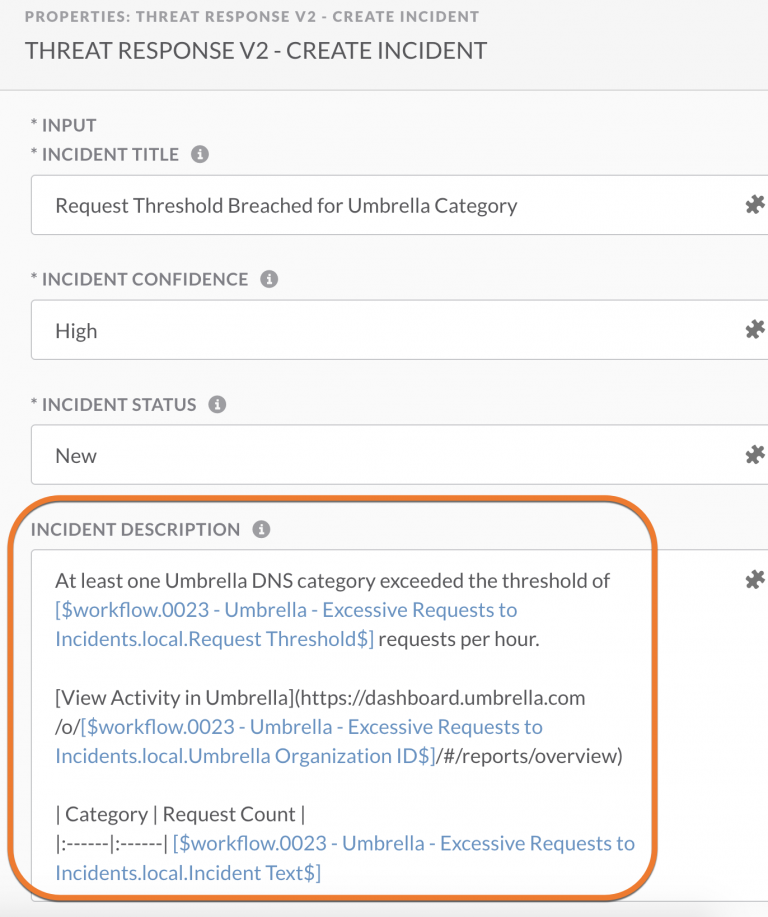
If the conditions are met, and there was activity in Umbrella, the workflow will automatically create a SecureX incident. This incident can be assigned to a team member and investigated in SecureX threat response, to gain additional context from various intelligence sources. However, our team decided that simply creating the SecureX incident was not enough and that a more active form of notification was necessary to ensure nothing got overlooked. Using the pre-built code blocks in SecureX orchestration, we customized the workflow to print a message in Webex teams this way the whole team can be notified and nothing will go unseen.


Here is what the message looks like in Webex teams. It includes includes the name of the category and how many requests in said category were seen in the past one hour. We scheduled the workflow to run once an hour, so this way even if we needed to step away to walk the Black Hat floor or meet with a NOC partner, we can still stay abreast to the latest Umbrella detections.

It also includes a hyperlink to the SecureX incident to make the next step of conducting an investigation easier. Using SecureX threat response we can investigate any domains detected by umbrella to get reputational data from multiple intelligence sources. In this particular example www.tqlkg[.]com showed up as ‘potentially harmful’ in the Umbrella activity report. The results of the threat response investigation show dispositions from 5 different sources including a suspicious disposition from both Talos and Cyberprotect. We can also see that the domain resolves to 6 other suspicious URLs. In a future version of this workflow this step could be automated using the SecureX API’s.

In addition to the Webex teams alert, we created a tile for notification the SecureX dashboard, which is on display for the entire NOC floor to view.

You can see in the dashboard high level statistics, which are provided from Secure Malware Analytics (Threat Grid) including “top behavioral indicators”, “submissions by threat score” “submissions by file type” as well as the “request summary” from Umbrella.
Also notice the “private intelligence” tile – this is where you can see if there were any new incidents created by the orchestration workflow. The SecureX dashboard keeps the entire Black Hat NOC well-informed as to how Cisco Secure’s portfolio is operating in the network. Adding tiles to create a custom dashboard can be done in just a few clicks. In the customize menu you will see all the integrated technologies that provide tiles to the dashboard. Under the “private intelligence” section you can see the option to add the ‘Incident statuses and assignees’ tile to the dashboard – it’s that easy to create a customized dashboard!

I hope you enjoyed this edition of SecureX at Black Hat; and stay tuned for the next version of the workflow on GitHub, that will automatically conduct an investigation of suspicious domains and provide intelligence context directly in the Webex teams message.
We’d love to hear what you think. Ask a Question, Comment Below, and Stay Connected with Cisco Secure on social!
Cisco Secure Social Channels
Instagram
Facebook
Twitter
LinkedIn
Share:

