Monitoring Linux system resources with bpytop

The bpytop tool is similar to other performance monitoring tools available for Linux systems like top, iotop, htop, bashtop etc. It’s a terminal-based resource monitor that works efficiently and is visually appealing.
The tool was ported from bashtop and rewritten in Python, so you need to have Python—version 3.6 or later—installed on your system to use it. (The “bpy” portion of the name undoubtedly stands for “bash Python”.)
If you already have Python installed on your system, you can check the version using one of these sets of commands:
Fedora                       Linux Mint
======                       ==========
$ which python               $ which python3
/usr/bin/python              /usr/local/bin/python3
$ python -V                  $ python3 -V
Python 3.9.7                 Python 3.8.10
Both systems shown are running Python3, but the Fedora system has /usr/bin/python set up as a symbolic link to python and the other system does not. So, they’re both using Python3.
Here’s how to install bpytop on Fedora and on Linux Mint. On Fedora, do this:
$ sudo dnf install bpytop
If required, you can remove it with this command:
$ sudo dnf remove bpytop
The tool can also be installed from the Snap Store. If your prefer this, use these commands:
$ sudo dnf install snapd
$ sudo ln -s /var/lib/snapd/snap /snap
$ sudo snap install bpytop
To install bpytop on Linux Mint, run the commands below.
$ sudo apt install python3-pip
$ sudo pip3 install bpytop
$ which bpytop
/usr/local/bin/bpytop
You can upgrade with a command like this:
$ sudo pip3 install bpytop —upgrade
You can uninstall the snap version with this command:
$ sudo pip3 uninstall bpytop
Using bpytop
Like top, bpytop displays processor, memory, disk, network, process usage, and statistics. The display is very flexible, but might take some time to learn all that it can do. To begin, you might have to stretch out your terminal window to provide the screen space required (at least 80 x 24). The tool will complain if the area is insufficient.
The bpytop tool does not install with a man page, but you can get a little help with the bpytop —help command.
$ man bpytop
No manual entry for bpytop
$
$ bpytop —help
usage: bpytop [-h] [-b BOXES] [-lc] [-v] [—debug]

optional arguments:
  -h, —help            show this help message and exit
  -b BOXES, —boxes BOXES
                        which boxes to show at start, example: -b “cpu mem net
                        proc”
  -lc, —low-color      disable truecolor, converts 24-bit colors to 256-color
  -v, —version         show version info and exit
  —debug               start with loglevel set to DEBUG overriding value set
The best way to learn to use bpytop is to spend some time with it and trying different options. After a while, it will become easier to get it to display just what you want to focus on.
To start bpytop, just type “bpytop” on your command line.
$ bpytop
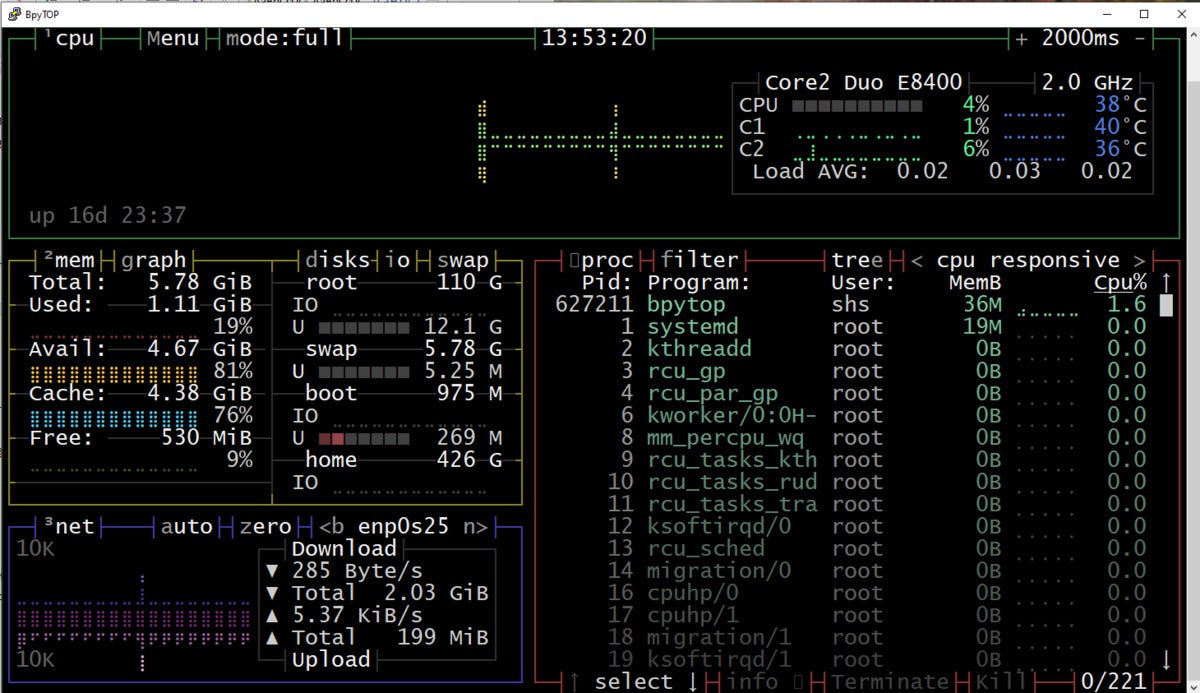
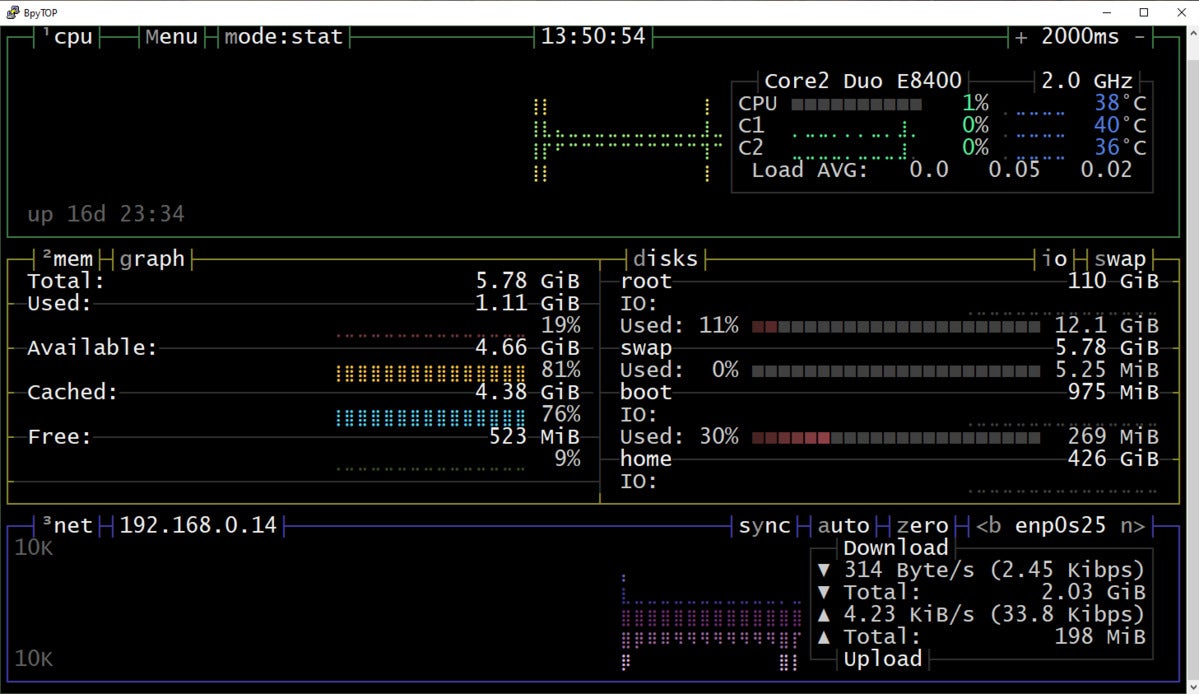
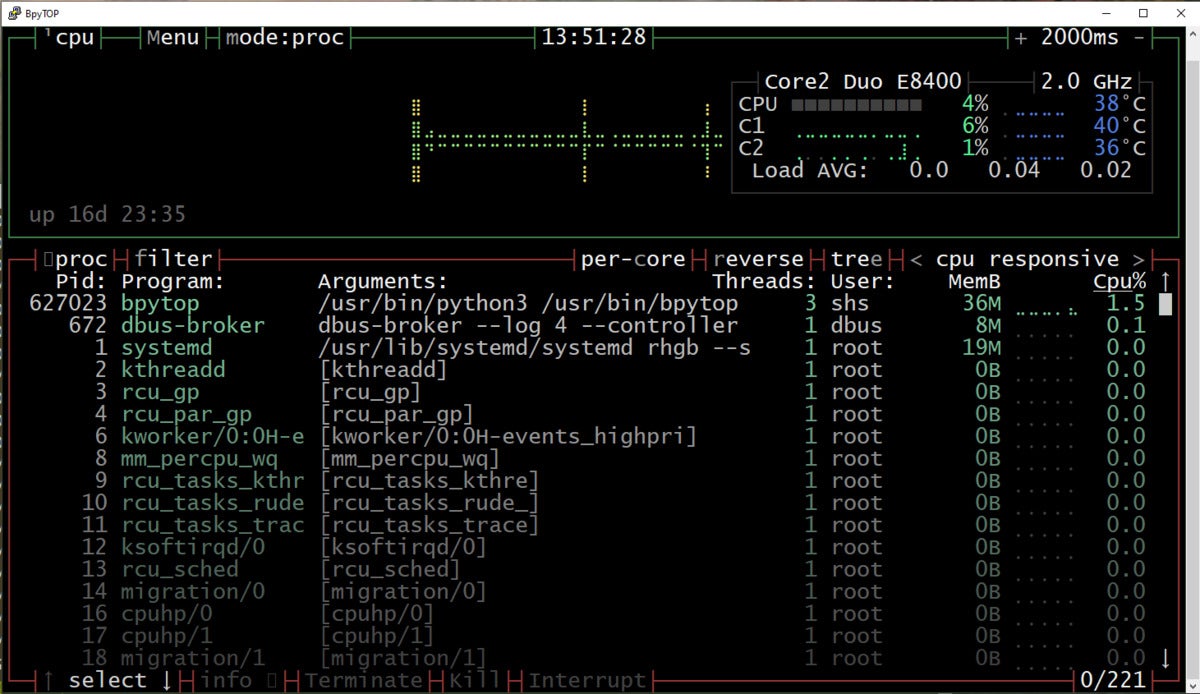
The tool has three modes: full, stat and proc. On first use, the tool will start in full mode, andyou should see “mode:full” on the top line of the display. If you click on “mode:full”, you will move into “mode:stat”, and if you can click again, you’ll go into “mode:proc”. Each mode shows different amounts and types of data with a good amount of overlap. The proc mode focuses on processes, but all the modes include some variety of data.
The images below illustrate the layout of each of the three modes.
 Sandra Henry-Stocker
Full mode
Figure 1: Full mode
 Sandra Henry-Stocker
Stat mode
Figure 2: Stat mode
 Sandra Henry-Stocker
Proc mode
Figure 3: Proc mode
It’s important to understand that whatever mode you are using when you exit bpytop will be the mode that the tool will start in next time. You can, however, instruct the tool on the things you want to focus on. For example, typing bpytop -b “mem cpu” will get the tool on those aspects of performance. The -b argument selects which “boxes” of performance details you want to view.
The command shown below will start bpytop with all data options and restores them as your default.
$ bpytop -b “cpu mem net proc”
If you use the command below, you will have the option to display memory use in either of two graph forms. To get it to start in full mode next time, you will have to use the command shown above.
$ bpytop -b “mem”
In full mode or proc mode, you can use the up and down arrow keys to select a particular process. In proc mode, you can then terminate, kill or interrupt a process if you have sufficient authority. To kill a process, click on “Kill” on the bottom line of the display.
Type q or ^c to quit.
Wrap-Up
The bpytop tool is an excellent tool for viewing important performance stats on your Linux system. It may take a little time to get accustomed to how it works, but you’ll likely enjoy using it and find many helpful ways to examine performance.
Copyright © 2021 IDG Communications, Inc.

