- Sony will give you a free 55-inch 4K TV right now - but this is the last day to qualify
- I've used virtually every Linux distro, but this one has a fresh perspective
- I replaced my JBL speaker with this surprise alternative. Here's why it's my new top pick
- I replaced my JBL speaker with this surprise alternative. Here's why it's my new top pick
- Every dad should build their toolkit with theses 10 DIY gadgets
How Cisco IT reduced Mean-Time-to-Resolution with Cisco Nexus Dashboard

Network operations teams have always been under pressure, but the upheaval caused by the pandemic quickly increased the strain. With agility, remote productivity, collaboration, and unwavering uptime becoming more important than ever, network teams are now reevaluating their capabilities, processes, and tool sets. And many are realizing a reactive, break-fix approach is no longer viable.
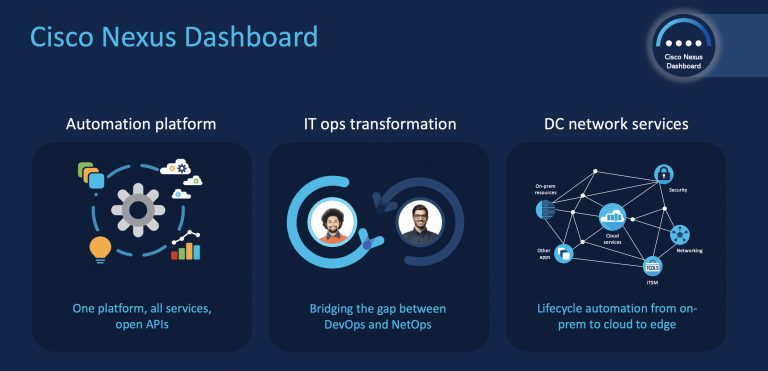
The only way to meet today’s continuity, availability, and security requirements is to establish a proactive and predictive operational approach that aligns people, processes, and technology. Key to these “ops of the future” is a network and an operation’s infrastructure that provides automation, self-healing, and enhanced visibility to reduce mean-time-to-know (MTTK). Cisco Nexus Dashboard is the comprehensive platform that enables this ”true north” for operations teams’ charged with running the most critical infrastructure smoothly.
The current state of affairs
Operational complexity can be mapped along three dimensions:
- Scale
- Diversity of application architecture
- Diversity of workload and execution venues
Even small, incremental changes along any of these dimensions (e.g. migrating a VM to public cloud) can lead to an exponential increase in downstream complexity for a network operations team.
When something unexpected happens in a network – especially a large, globally distributed environment like Cisco’s – it can quickly turn into a disjointed forensic investigation. Armed with domain-specific data from domain-specific management tools, network operations specialists try to piece together a consolidated version of the problem and its root-cause.
“We’re a networking team, not a data science team. We need the ability to see the big picture, and if something goes wrong,
we need to know exactly where to look instead of poking around and hoping to get lucky.”
– John Banner, network architect for Cisco IT, noting the proliferation of dashboards
and the difficulty of correlating information among them.
Sometimes they find a solution on their own, often relying on unstructured tribal knowledge and wondering if they had seen the issue occur before. Other times they have to involve multiple vendors.
Regardless, these investigations always take up too much time and resources. They force network operations teams to reactively reconcile different versions of the truth. And they can devolve into unproductive disputes, with finger-pointing between teams and vendors that invariably prolongs mean-time-to-resolution (MTTR) and MTTK.
By bringing these functions together in a single product portfolio, Nexus Dashboard gives operations teams – including NetOps, CloudOps, SecOps, and DevOps – a single, correlated version of the truth. It doesn’t just align tools and technologies, but also enables standardized processes that multiple teams can participate in.

If something goes wrong, Nexus Dashboard pinpoints the problem and accurately shows what occurred, where it occurred, and what has been impacted. It also provides prescriptive and actionable recommendations for how to resolve the problem.
No forensic investigations. No correlation of data from spreadsheets, screen shots, and CLIs. No finger-pointing.
Just a clear understanding of the situation and the ability to quickly resolve it – or in most cases, avoid it altogether.
Success with the Nexus Dashboard
Our own Cisco IT was looking to transform its network operations, consolidate a growing collection of tools, and become more proactive and efficient with its processes. The team adopted Nexus Dashboard to improve the management of 10 network fabrics, 70 network appliances, 35,000 endpoints, and 900 applications. And the results have been noteworthy:
- Cut time spent going back-and-forth between monitoring tools by 50 percent.
- Reduced correlation efforts by 40 to 50 percent.
- Reduce Mean Time To Detect (MTTD) by 30 percent.
Automation, visibility, and programmability are the hallmarks of Cisco Nexus Dashboard. And based on the experience of Cisco IT, it can dramatically improve network operations, troubleshooting, and MTTK.
To learn more about Cisco IT’s use of Nexus Dashboard, read the full case study. And if you are struggling to piece together different versions of the truth within your data center, take a look at this demo video.
Resources
Cisco Nexus Dashboard Insights
Cisco Nexus Dashboard webinars
Share:


