- IBM’s cloud crisis deepens: 54 services disrupted in latest outage
- Proton VPN vs. Private Internet Access: Which VPN should you choose?
- Moderna’s HR-IT merger: Trend or exception to the rule?
- I tested Google's Veo 2 video generator on an Android phone - the results left me very conflicted
- AMD acquires Brium to loosen Nvidia’s grip on AI software
Announcing Builds View in Docker Desktop GA | Docker

As an engineer in a product development team, your primary focus is innovating new services to push the organization forward. We know how frustrating it is to be blocked because of a failing Docker build or to have the team be slowed down because of an unknown performance issue in your builds.
Due to the complex nature of some builds, understanding what is happening with a build can be tricky, especially if you are new to Docker and containerization.
To help solve these issues, we are excited to announce the new Builds view in Docker Desktop, which provides detailed insight into your build performance and usage. Get a live view of your builds as they run, explore previous build performance, and deep dive into an error and cache issue.
What is causing my build to fail?
The Builds view lets you look through recent and past builds to diagnose a failure long after losing the logs in your terminal. Once you have found the troublesome build, you can explore all the runtime context of the build, including any arguments and the full Dockerfile. The UI provides you with the full build log, so you no longer need to go back and re-run the build with --progress=plain to see exactly what happened (Figure 1).


You can see the stack trace right next to the Dockerfile command that is causing the issues, which is useful for understanding the exact step and attributes that caused the error (Figure 2).

You can also check whether this issue has happened before or look at what changed to cause it. A jump in run time compared to the baseline can be seen by inspecting previous builds for this project and viewing what changed (Figure 3).


What happened to the caching?
We often hear about how someone in the team made a change, impacting the cache utilization. The longer such a change goes unnoticed, the harder it can be to locate what happened and when.
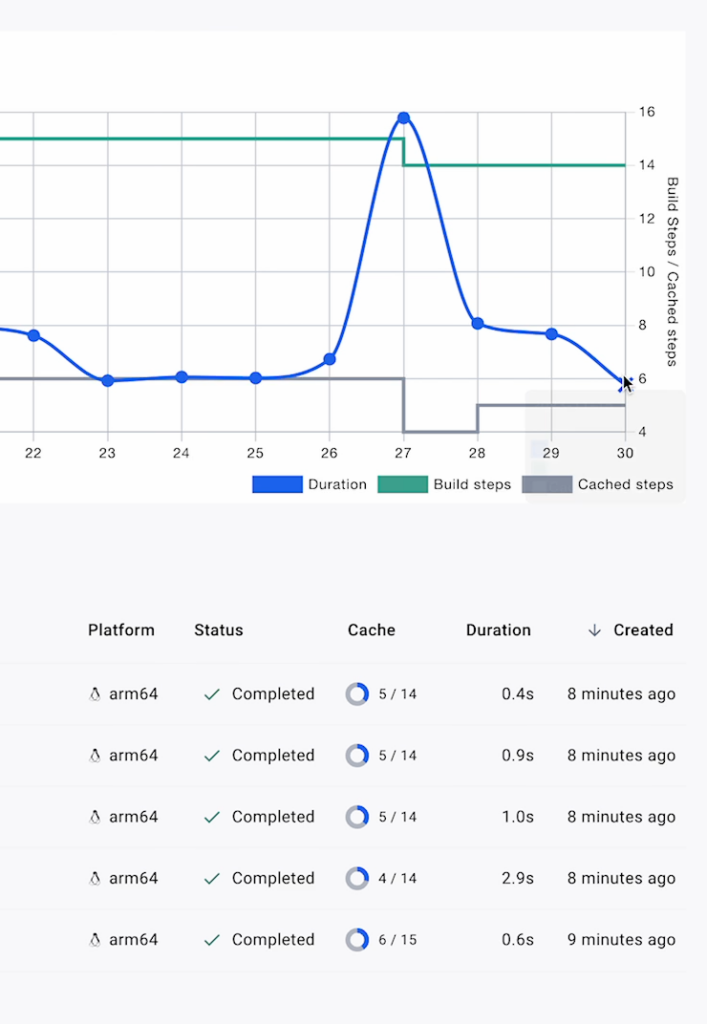
The Builds view plots your build duration alongside cache performance. Now, it’s easy to see a spike in build times aligned with a reduction in cache utilization (Figure 4).

You can click on the chart or select from the build history to explore what changed before and after the degradation in performance. The Builds view keeps all the context from your builds, the Dockerfile, the logs, and all execution information (Figure 5).

You can even see the commit and source information for the build and easily locate who made the change for more help in resolving the issue (Figure 6).


An easier way to manage builders
Previously, users have been able to manage builders from the CLI, providing a flexible method for setting up multiple permutations of BuildKit.
Although this approach is powerful, it would require many commands to fully inspect and manage all the details for your different builders. So, as part of our efforts to continuously make things easier for developers, we added a builder management screen with Docker Desktop (Figure 7).

All the important information about your builders is available in an easy-to-use dashboard, accessible via the Builds view (or from settings). Now, you can quickly see your storage utilization and inspect the configuration.

You can also switch your default builder and easily start and stop them (Figure 8). Now, instead of having to look up which command-line options to call, you can quickly select from the drop-down menu.
Get started
The new Builds view is available in the new Docker Desktop 4.26 release; upgrade and click on the new Builds tab in the Dashboard menu.
We are excited about the new Builds view, but this is just the start. There are many more features in the pipeline, but we would love to hear what you think.
Give Builds view a try and share your feedback on the app. We would also love to chat with you about your experience so we can make the best possible product for you.
Update to Docker Desktop 4.26 to get started!

