- Learn with Cisco at Cisco Live 2025 in San Diego
- This Eufy robot vacuum has a built-in handheld vac - and just hit its lowest price
- I highly recommend this Lenovo laptop, and it's nearly 50% off
- Disney+ and Hulu now offer prizes, freebies, and other perks to keep you subscribed
- This new YouTube Shorts feature lets you circle to search videos more easily
Accelerating to Hybrid Cloud with Cisco Nexus Dashboard – Cisco Blogs

We are working in a multdimensional world of data and applications accessed by a workforce shifting among work-from-home offices to centralized campuses to work-from-anywhere. Data is widely distributed and business-critical applications are becoming containerized microservices disseminated over on-premises, edge cloud, and public cloud data center locations. These applications rely on agile and resilient networks to provide the best level of experience for the workforce and customers.
It is therefore a multidimensional challenge for IT to keep applications and networks in sync. With the ever increasing scope of the roles NetOps and DevOps, an automation toolset is needed to accelerate data center operations and securely manage the expansion to hybrid and multicloud. Cisco Nexus Dashboard provides a single focal point to unite the disparate views of globe-spanning multicloud data center operations, application deployment, and performance.
Accelerate IT Operations
When working with a myriad of shifting cloud services, multi-site connections, and third-party APIs, it can be arduous to continuously accelerate hybrid cloud and multi-datacenter operations. Cisco Nexus Dashboard combines Orchestrator, Insights, Data Broker and third-party services to give NetOps and DevOps teams an intuitive view of multiple data center fabrics. It provides the ability for NetOps to focus on critical anomalies, revealing root causes and providing remediation suggestions that can be implemented with a click. It also provides DevOps with an automation toolset to manage and optimize applications.
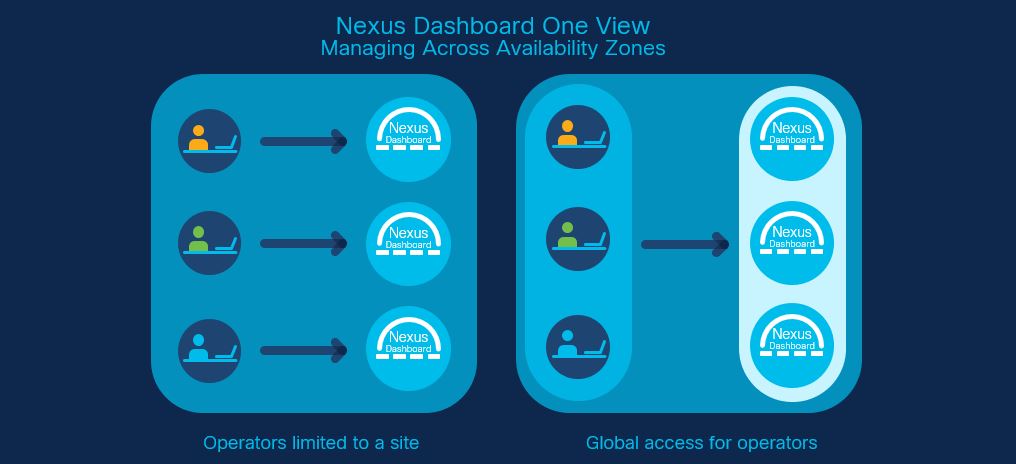
Each Nexus Dashboard instance can monitor multiple fabrics in a chosen availability zone and then roll status information up into a global Nexus Dashboard One View, providing full-stack observability across a global collection of fabrics. The full integration of Orchestrator, Insights, and Data Broker capabilities under the Nexus Dashboard is reflected in the updated names for each of these services.
Cisco Nexus Dashboard Orchestrator (previously Cisco Multi-Site Orchestrator) enables NetOps to set consistent connectivity and security policies across multiple data center sites and fabrics. Nexus Dashboard Orchestrator also enables end-to-end automation across data center, SD-WAN, and enterprise branch and campus networks. Integration with Cisco SD-WAN optimizes path selection for traffic among data centers and branches to deliver on application Service Level Objectives. Integration with Cisco DNA Center delivers consistent identity-based security policies across the workforce and applications.
Cisco Nexus Dashboard Insights (previously Cisco Nexus Insights) incorporates a set of advanced alerting, baselining, correlation, and forecasting algorithms to provide deep understandings into the behavior of the network. It also analyzes flow telemetry data streamed from Nexus 9000 switches across data center networks to provide full-stack observability. Cisco Nexus Dashboard Insights automates troubleshooting and helps rapidly determine root-causes of performance issues and suggests possible remediations that can be implemented with one click. The Insights service and Cisco AppDynamics are tightly integrated to pinpoint exactly where and when an application issue originated from a network perspective. This results in proactive notifications, shorter time to troubleshoot, and better coordination between DevOps and NetOps.
The enhanced Nexus Dashboard Data Broker (previously Cisco Nexus Data Broker) is now part of Nexus Dashboard, enabling NetOps to programmatically manage aggregating, filtering, and forwarding complete flows to custom analytics tools. The Nexus Dashboard Data Broker can be used with both Nexus and Catalyst fabrics. It replaces the traditional purpose-built network packet broker appliances with high-throughput Nexus switches enabling IT to create more scalable and cost-effective packet broker fabrics.
Third-Party Automation Tools are critical to improving reporting workflows and responding to issues encountered by distributed workloads. Cisco Nexus Dashboard has built-in integrations with many third-party services such as ServiceNow, one of the most prevalent IT Service Management platforms. With the ServiceNow integrations, NetOps and DevOps can open and track tickets from within Nexus Dashboard. From one portal, Ops teams get visibility into the status of open tickets, resulting in the automation of troubleshooting for faster resolutions across fabrics.
With these integrated services united in Nexus Dashboard, NetOps can achieve command and control over global network fabrics, optimizing performance and attaining insights into data center and cloud operations.
Securely Expand to Hybrid Cloud with Nexus Dashboard Orchestrator
To work efficiently in a multicloud world, IT needs to be able to capture business and operational intents and translate them into native policies for applications deployed across various cloud environments. The Cisco Nexus Dashboard Orchestrator enables application availability and segmentation for bare-metal, virtualized, containerized, or microservices-based applications deployed across multiple cloud domains. Using a common policy and operating model drastically reduces the cost and complexity of managing hybrid and multicloud deployments on Microsoft Azure, Amazon Web Services, and Google Cloud.
Nexus Dashboard Orchestrator also links on-premises data centers to public cloud platforms by automating the replication and translation of policies established in the data center or a specific cloud provider into policies that work in another cloud provider. As the central coordinator of inter-site policies, Cisco Nexus Dashboard Orchestrator pushes the same policies to multiple data centers and public clouds across the globe in a single step. This means that IT can move applications from on-premises to cloud provider “A” to cloud provider “B” and all the policies are automatically transferred and translated without human intervention. The resulting savings in time and cost are significant when working in a hybrid or multicloud world. Cisco provides IT organizations with the agility to deploy workloads in any location and any cloud, based on business benefits and not technology limitations.
Google Cloud Integration with Cisco SD-WAN Cloud Hub and Cloud Application Centric Infrastructure via Nexus Dashboard
Cisco and Google are building the industry’s first multicloud application-centric fabric and the Nexus Dashboard is at the center for orchestration and management. Using the Cisco SD-WAN Cloud Hub to connect to the Google Cloud Network Connectivity Center, the Cisco Nexus Dashboard Orchestrator enables integration of Cisco ACI and Cloud ACI policy extensions directly into Google Cloud (available in Fall 2021) via the Nexus Dashboard Orchestrator. Cisco Cloud Application Policy Infrastructure Controller (APIC) runs natively in public clouds such as Google Cloud, AWS, and Microsoft Azure, providing automated connectivity, policy translation, and enhanced visibility of workloads across public clouds.
Enabling DevOps to Deliver the Best Application Experience
From the workforce point of view, a significant aspect of excellent application experience is the ability of DevOps to rapidly deliver new application releases and fix existing issues affecting workflows. NetOps, in turn, needs the network to keep pace with continuous integration/continuous delivery of hybrid and cloud applications. The two teams can now work together using an Infrastructure as Code (IaC) approach. DevOps can update applications in data centers and clouds without requesting NetOps deployment assistance, while NetOps knows that the processes DevOps is using are predefined, tested, and approved, relegating fat-finger mistakes to the proverbial dustbin of history.
Via Cisco Nexus Dashboard, DevOps can improve the application deployment experience for multicloud applications with HashiCorp Terraform and Consul IaC integrations. Developers describe in code the components and resources needed to run an application in a data center or cloud.
Flexible Deployment is Key for Hybrid-Cloud Enterprises
Nexus Dashboard is available as an on-premises appliance today. It will be available as a virtual appliance and a cloud hosting option in Q2’21. IT can deploy Nexus Dashboard when and where it is most efficient. You can learn more at these sites:
Cisco Nexus Dashboard At-a-Glance
Cisco Cloud ACI Solution Overview
Cisco ACI and Hashi Corp Terraform Integration Solution Overview
Network Infrastructure Automation solutions overview
What is NetOps? From NetOps to DevOps
Share:


