- Key Cybersecurity Considerations for 2025
- Stock your Kindle for summer: Get up to 93% off popular reads during Amazon's Book Sale
- I replaced my TV with a 4K UST projector - and the visual upgrade was worth it
- This Amazon Fire TV soundbar gave me room-filling audio without breaking the bank
- I found a Garmin smartwatch that's ideal for those who don't like the rugged design
Cisco Meraki Add-on for Splunk, New and Improved!

Introducing version 3 of the Cisco Meraki Add-on for Splunk.
A Splunk technical add-on (TA) is a modular component that normalizes, validates, and enriches specific data sources before indexing in Splunk to enable proper searching, reporting, and analysis without changing the underlying raw data.
Keeping track of your networks shouldn’t feel like detective work. But when you’ve got multiple Meraki organizations, various vendors, security concerns, and performance issues to monitor, it can get overwhelming. That’s where the Cisco Meraki Add-on for Splunk comes in—it simplifies network observability by bringing your key data and metrics into one easy-to-use platform.
The Meraki TA helps you to:
✔ Unify your network insights across multiple Meraki organizations.
✔ Monitor security and application data alongside infrastructure health and over extended periods of time.
✔ Create custom dashboards and automate responses to network events.
In v2, the Add-on provided data inputs focused on:
✅ Security & Event Monitoring – Track organization-wide security events, Air Marshal detections, and network device logs.
✅ Infrastructure Insights – Get data on access points, cameras, security appliances, and switches.
✅ Configuration Tracking – See audit logs of organization configuration changes.
We’ve expanded the Meraki Add-on with even more capabilities. Here’s what’s available now.
✅ Device & Network Insights
- Device Availability Change History – Track the uptime and downtime of devices over time.
- Device Uplink Addresses – View the latest uplink addresses for devices in an organization.
- Wireless Ethernet Status – See Ethernet link speed, duplex, aggregation, and power mode for wireless devices.
- Packet Loss Metrics – Get average packet loss per device over a given timespan.
- Historical Sensor Readings – Retrieve all sensor data logs for temperature, humidity, and other metrics.
✅ Top Usage & Performance Rankings
- Top 10 Appliances by Utilization – See which firewalls and SD-WAN appliances are handling the most traffic.
- Top 10 Clients by Data Usage – Find out which devices or users consume the most bandwidth.
- Top 10 Devices by Usage – Rank devices by network consumption.
- Top 10 Switches by Energy Usage – Identify high-energy-consuming switches to optimize efficiency.
✅ Advanced Assurance & API Analytics
- Health Alerts – Get a centralized log of all health-related alerts across your network.
- API Request History & Response Codes – Track API usage and responses to optimize performance.
✅ SD-WAN & Cellular Gateway Monitoring
- VPN Status & Stats – Keep tabs on SD-WAN appliance performance.
- Cellular Gateway Uplink Status – Monitor uplink health for cellular gateways.
✅ Licensing & Firmware Management
- License Overview & Subscription Details – View all active licenses and subscription entitlements.
- Firmware Upgrade History – Track past firmware updates across your organization.
The add-on keeps the Meraki data in sync with Splunk via:
- APIs (Scheduled Reports) – Great for long-term analytics and reporting.
- Webhooks (Real-time Alerts) – Ideal for immediate event detection and automation.
We also made sure it supports the Meraki “full stack” of Cisco networking equipment.
- Appliances
- Cameras
- Cellular Gateways
- Switches
- Sensors
- Wireless Access Points
The Meraki Splunk Add-on is free and available now on Splunkbase.
Just install it and connect your Meraki organization(s) with an API key.
Read the documentation for complete details.
Quick Setup
1️⃣ Add your Meraki organization(s).
2️⃣ Choose the data you want to feed into Splunk.
3️⃣ Search, Discover and Visualize!
Quick Look at just some of the capabilities…
There are a number of sample visualizations provided in the add-on. You can use these as-is or for inspiration while creating your own custom dashboard.
Device Availability Stats and History
Monitor device uptime and network performance.
SD-WAN
Monitor the VPN connectivity across networks.
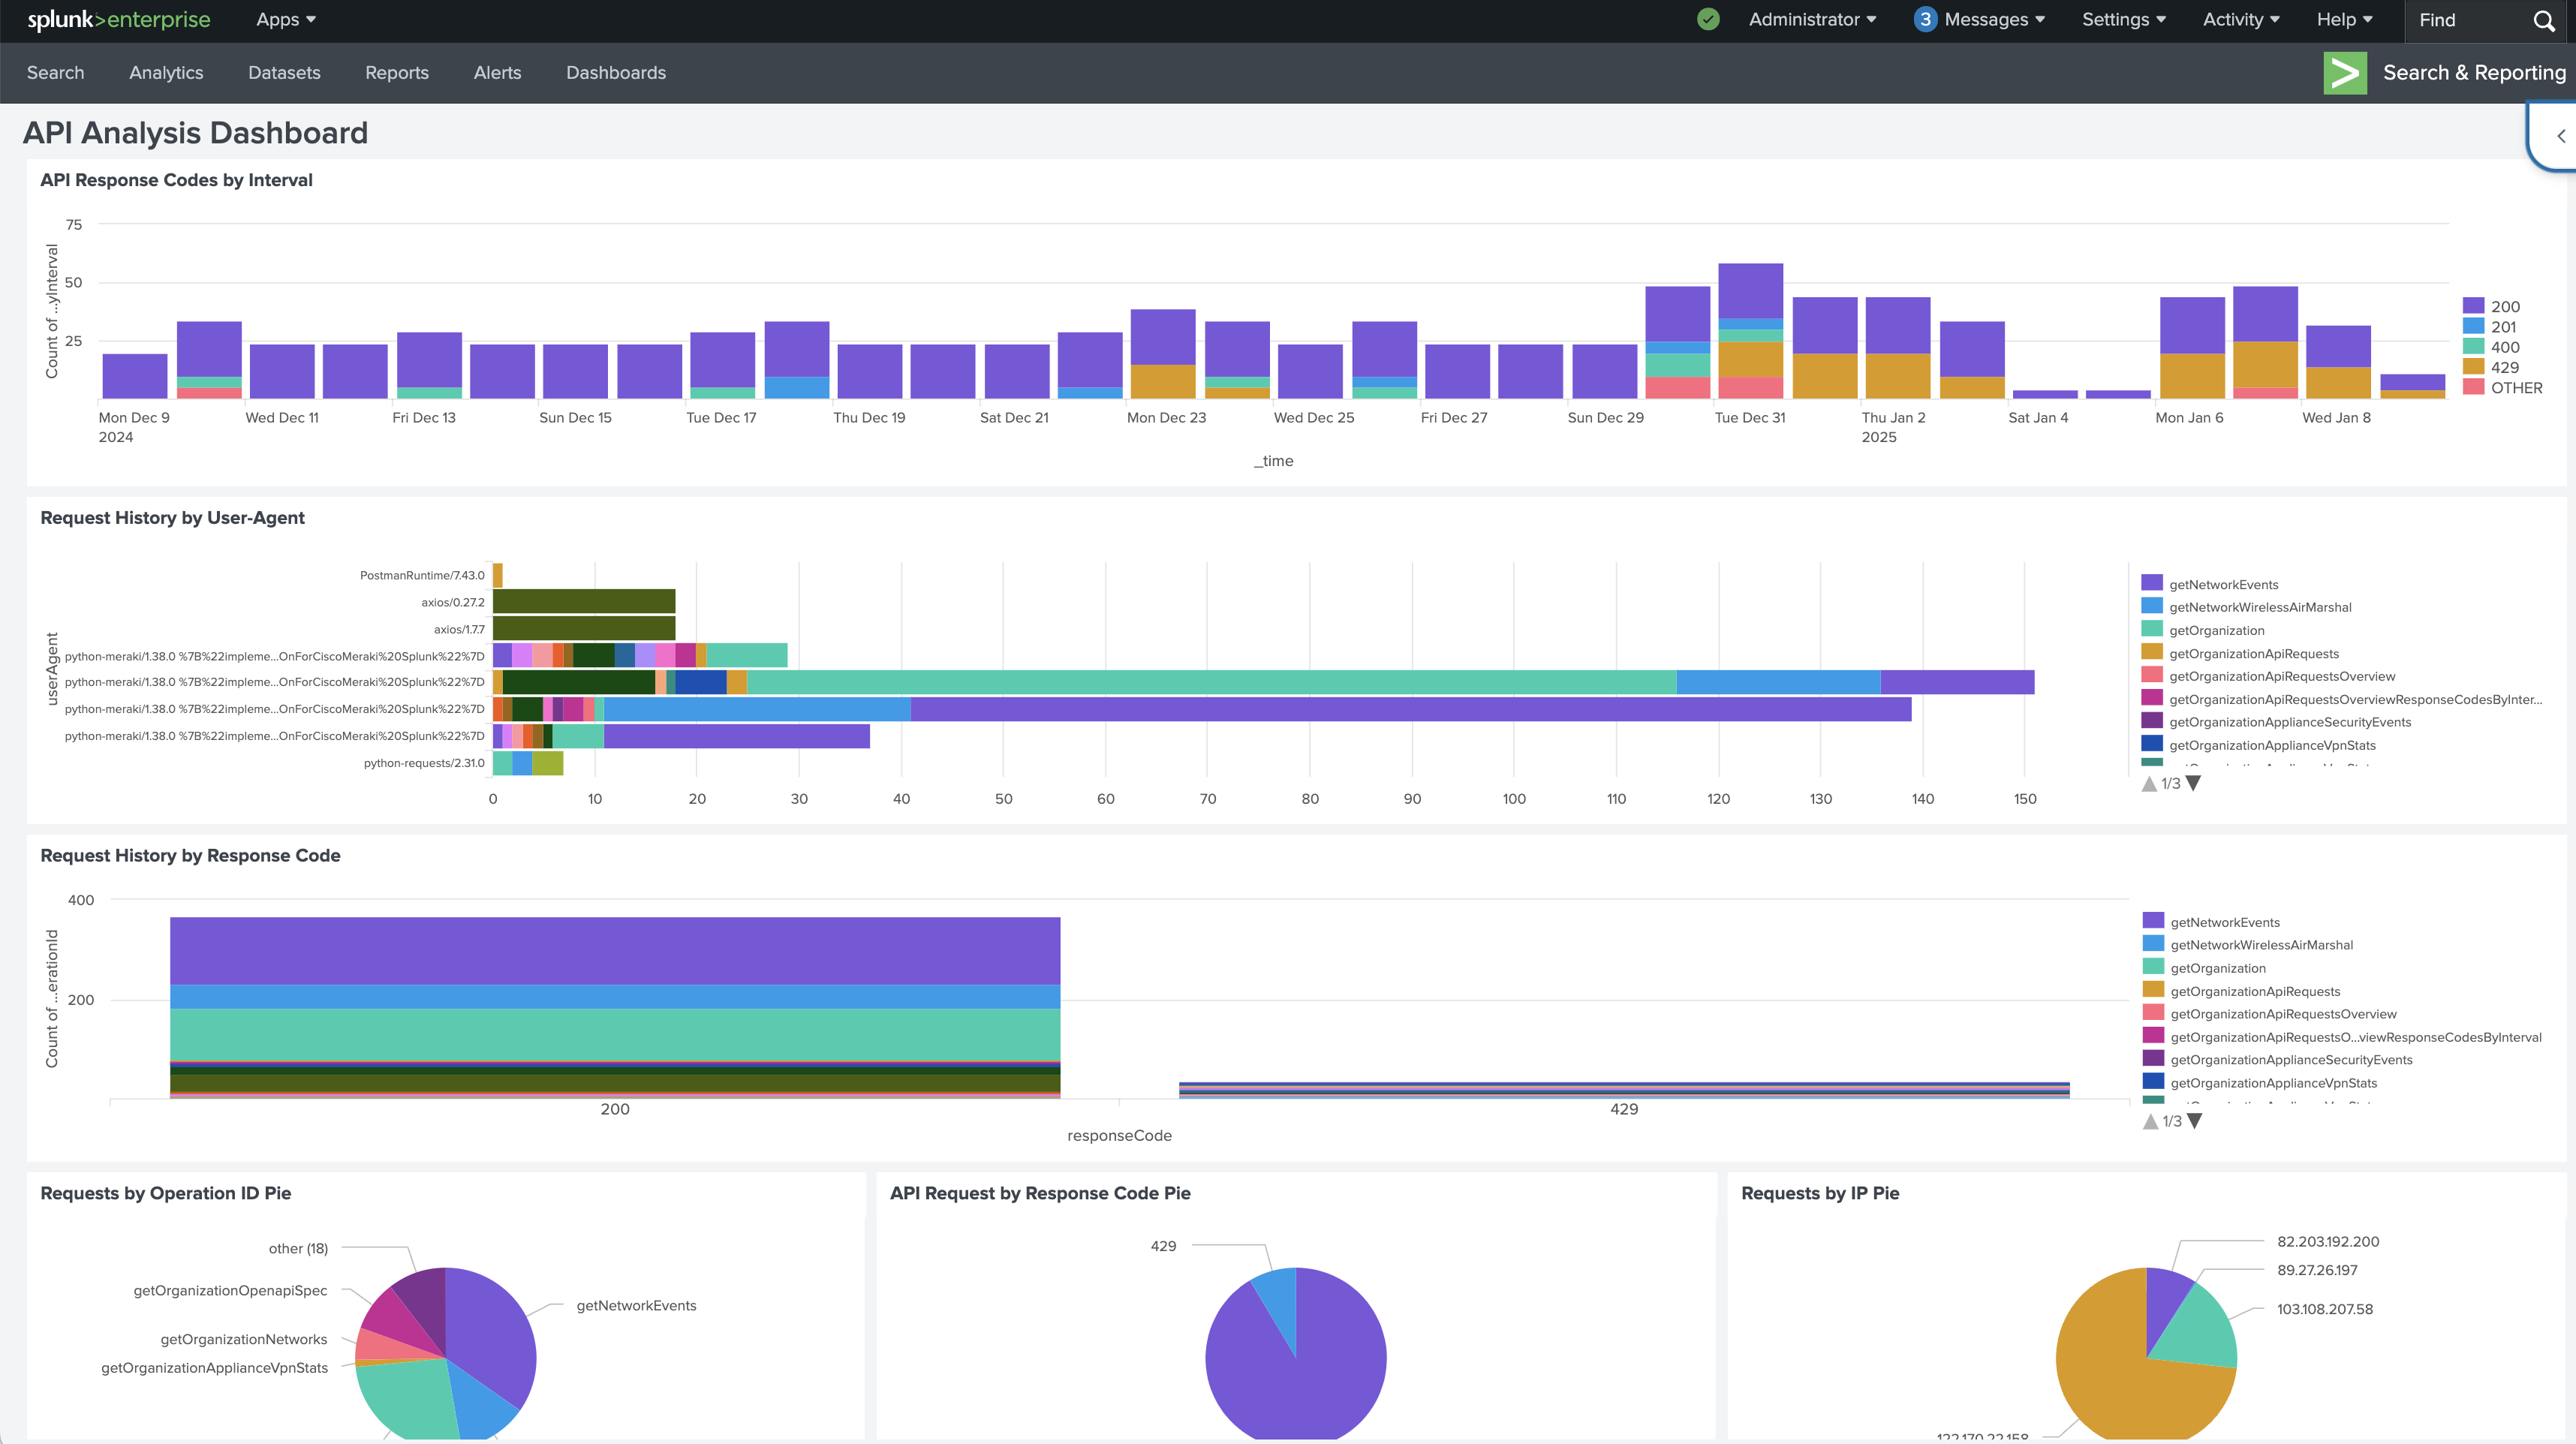
API Usage and Analysis
Great for figuring out rate-limit and application errors.
Track Switches by Energy Consumption
Identify heavy electricity usage.
Observability doesn’t have to be complex. With Meraki & Splunk, you can spot issues faster, automate smarter, and manage better.
Stay tuned for more to come!
Share:

