- Beyerdynamic's DT 990 Pro headphones get a refresh, promising portability without compromise
- How AI is helping PwC clients comply with European Union sustainability regulations
- The pressure is on for quick AI rollouts - but slow and steady wins this race too
- Forget Otter.ai: ChatGPT just entered the meeting room
- Seven Steps to Building a Mature Vulnerability Management Program
Learn how to make an AI chatbot from scratch | Docker

Today, we’ll show you how to build a fully functional Generative AI chatbot using Docker Model Runner and powerful observability tools, including Prometheus, Grafana, and Jaeger. We’ll walk you through the common challenges developers face when building AI-powered applications, demonstrate how Docker Model Runner solves these pain points, and then guide you step-by-step through building a production-ready chatbot with comprehensive monitoring and metrics.
By the end of this guide, you’ll know how to make an AI chatbot and run it locally. You’ll also learn how to set up real-time monitoring insights, streaming responses, and a modern React interface — all orchestrated through familiar Docker workflows.
The current challenges with GenAI development
Generative AI (GenAI) is revolutionizing software development, but creating AI-powered applications comes with significant challenges. First, the current AI landscape is fragmented — developers must piece together various libraries, frameworks, and platforms that weren’t designed to work together. Second, running large language models efficiently requires specialized hardware configurations that vary across platforms, while AI model execution remains disconnected from standard container workflows. This forces teams to maintain separate environments for their application code and AI models.
Third, without standardized methods for storing, versioning, and serving models, development teams struggle with inconsistent deployment practices. Meanwhile, relying on cloud-based AI services creates financial strain through unpredictable costs that scale with usage. Additionally, sending data to external AI services introduces privacy and security risks, especially for applications handling sensitive information.
These challenges combine to create a frustrating developer experience that hinders experimentation and slows innovation precisely when businesses need to accelerate their AI adoption. Docker Model Runner addresses these pain points by providing a streamlined solution for running AI models locally, right within your existing Docker workflow.
How Docker is solving these challenges
Docker Model Runner offers a revolutionary approach to GenAI development by integrating AI model execution directly into familiar container workflows.
Figure 1: Comparison diagram showing complex multi-step traditional GenAI setup versus simplified Docker Model Runner single-command workflow
Many developers successfully use containerized AI models, benefiting from integrated workflows, cost control, and data privacy. Docker Model Runner builds on these strengths by making it even easier and more efficient to work with models. By running models natively on your host machine while maintaining the familiar Docker interface, Model Runner delivers.
- Simplified Model Execution: Run AI models locally with a simple Docker CLI command, no complex setup required.
- Hardware Acceleration: Direct access to GPU resources without containerization overhead
- Integrated Workflow: Seamless integration with existing Docker tools and container development practices
- Standardized Packaging: Models are distributed as OCI artifacts through the same registries you already use
- Cost Control: Eliminate unpredictable API costs by running models locally
- Data Privacy: Keep sensitive data within your infrastructure with no external API calls
This approach fundamentally changes how developers can build and test AI-powered applications, making local development faster, more secure, and dramatically more efficient.
How to create an AI chatbot with Docker
In this guide, we’ll build a comprehensive GenAI application that showcases how to create a fully-featured chat interface powered by Docker Model Runner, complete with advanced observability tools to monitor and optimize your AI models.
Project overview
The project is a complete Generative AI interface that demonstrates how to:
- Create a responsive React/TypeScript chat UI with streaming responses
- Build a Go backend server that integrates with Docker Model Runner
- Implement comprehensive observability with metrics, logging, and tracing
- Monitor AI model performance with real-time metrics
Architecture
The application consists of these main components:
- The frontend sends chat messages to the backend API
- The backend formats the messages and sends them to the Model Runner
- The LLM processes the input and generates a response
- The backend streams the tokens back to the frontend as they’re generated
- The frontend displays the incoming tokens in real-time
- Observability components collect metrics, logs, and traces throughout the process
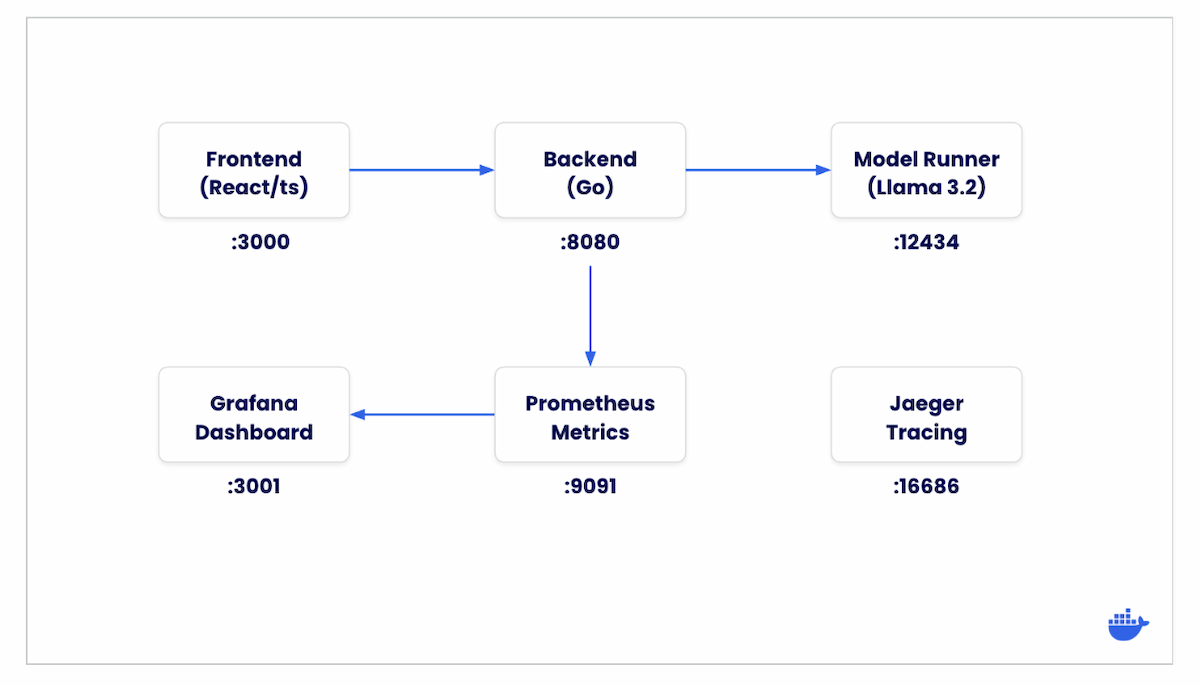
Figure 2: Architecture diagram showing data flow between frontend, backend, Model Runner, and observability tools like Prometheus, Grafana, and Jaeger.
Project structure
The project has the following structure:
tree -L 2
.
├── Dockerfile
├── README-model-runner.md
├── README.md
├── backend.env
├── compose.yaml
├── frontend
..
├── go.mod
├── go.sum
├── grafana
│   └── provisioning
├── main.go
├── main_branch_update.md
├── observability
│   └── README.md
├── pkg
│   ├── health
│   ├── logger
│   ├── metrics
│   ├── middleware
│   └── tracing
├── prometheus
│   └── prometheus.yml
├── refs
│   └── heads
..


21 directories, 33 files
We’ll examine the key files and understand how they work together throughout this guide.
Prerequisites
Before we begin, make sure you have:
- Docker Desktop (version 4.40 or newer)
- Docker Model Runner enabled
- At least 16GB of RAM for running AI models efficiently
- Familiarity with Go (for backend development)
- Familiarity with React and TypeScript (for frontend development)
Getting started
To run the application:
- Clone the repository:
git clone
https://github.com/dockersamples/genai-model-runner-metrics

cd genai-model-runner-metrics
- Enable Docker Model Runner in Docker Desktop:
- Go to Settings > Features in Development > Beta tab
- Enable “Docker Model Runner”
- Select “Apply and restart”
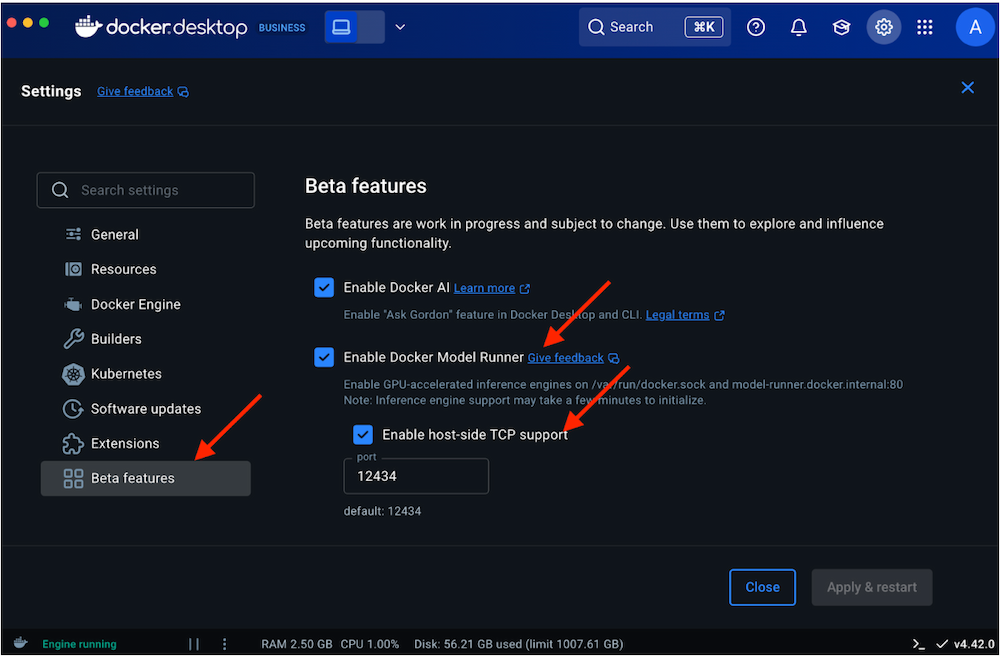
Figure 3: Screenshot of Docker Desktop Beta Features settings panel with Docker AI, Docker Model Runner, and TCP support enabled.
- Download the model
For this demo, we’ll use Llama 3.2, but you can substitute any model of your choice:
docker model pull ai/llama3.2:1B-Q8_0
Just like viewing containers, you can manage your downloaded AI models directly in Docker Dashboard under the Models section. Here you can see model details, storage usage, and manage your local AI model library.
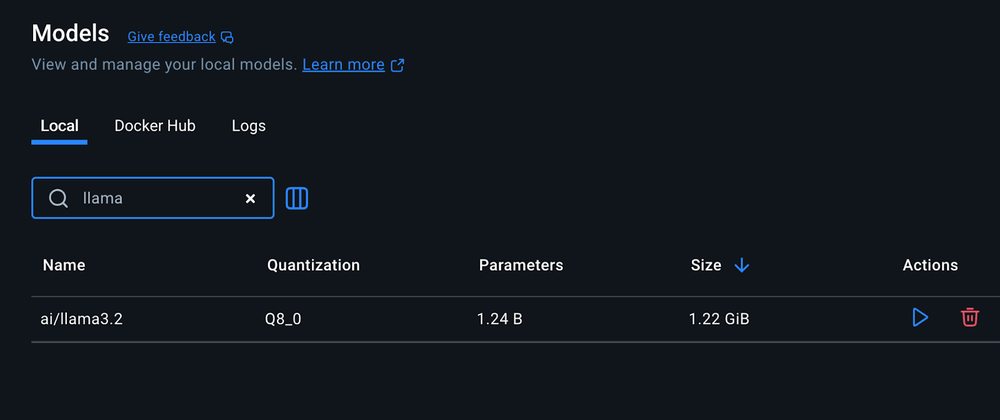
Figure 4: View of Docker Dashboard showing locally downloaded AI models with details like size, parameters, and quantization.
- Start the application:
docker compose up -d --build
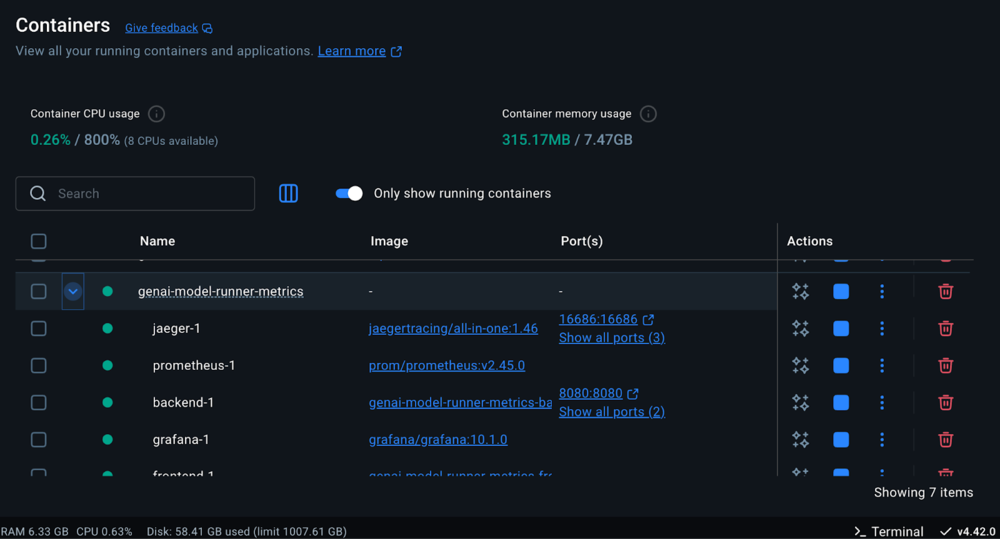
Figure 5: List of active running containers in Docker Dashboard, including Jaeger, Prometheus, backend, frontend, and genai-model-runner-metrics.
- Open your browser and navigate to the frontend URL at http://localhost:3000 . You’ll be greeted with a modern chat interface (see screenshot) featuring:
- Clean, responsive design with dark/light mode toggle
- Message input area ready for your first prompt
- Model information displayed in the footer
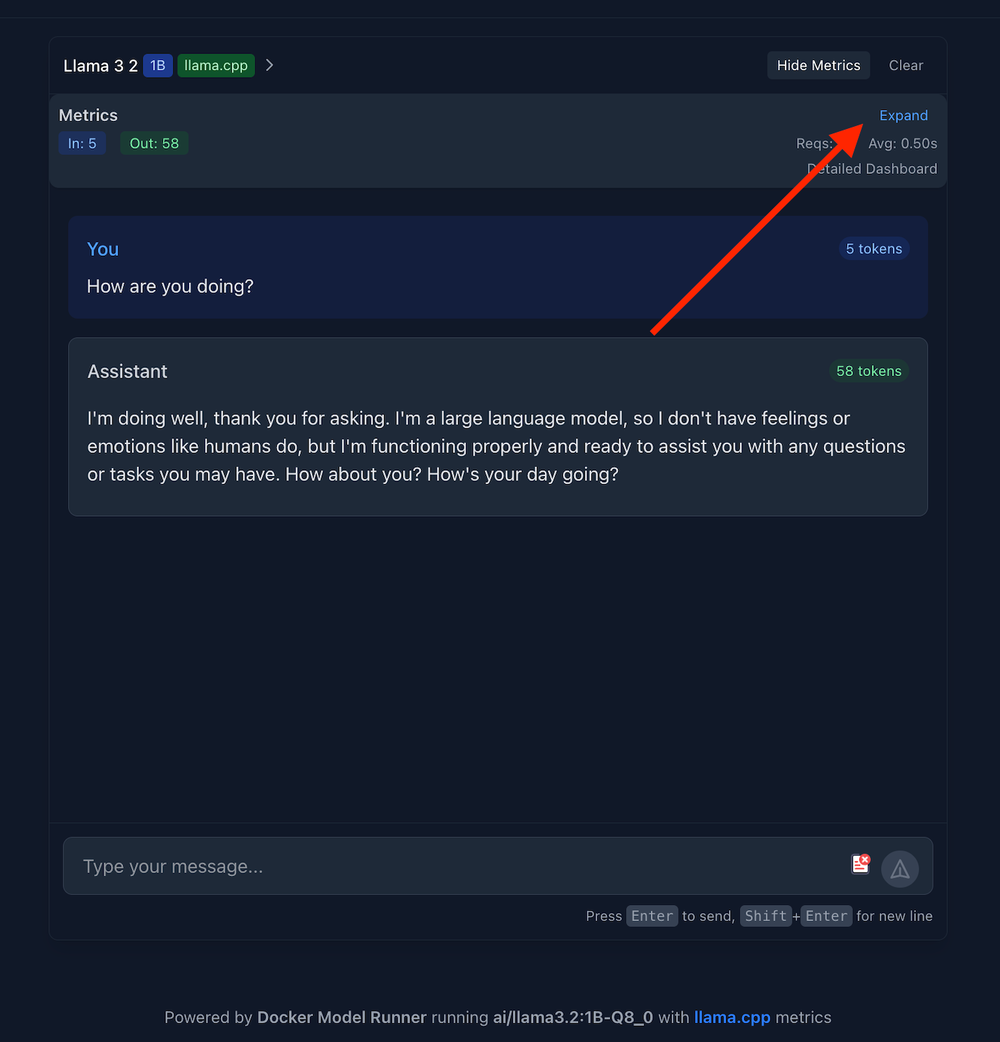
Figure 6: GenAI chatbot interface showing live metrics panel with input/output tokens, response time, and error rate.
- Click on
Expandto view the metrics like:
- Input tokens
- Output tokens
- Total Requests
- Average Response Time
- Error Rate
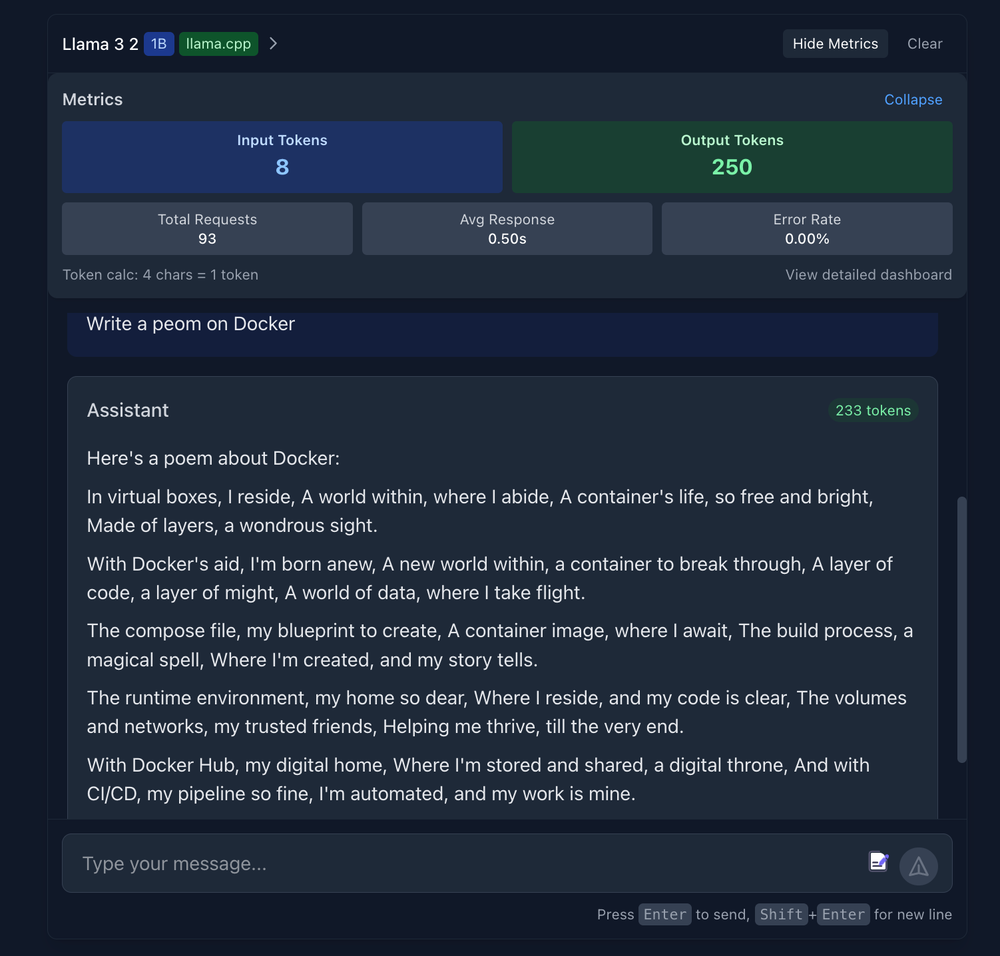
Figure 7: Expanded metrics view with input and output tokens, detailed chat prompt, and response generated by Llama 3.2 model.
Grafana allows you to visualize metrics through customizable dashboards. Click on View Detailed Dashboard to open up Grafana dashboard.
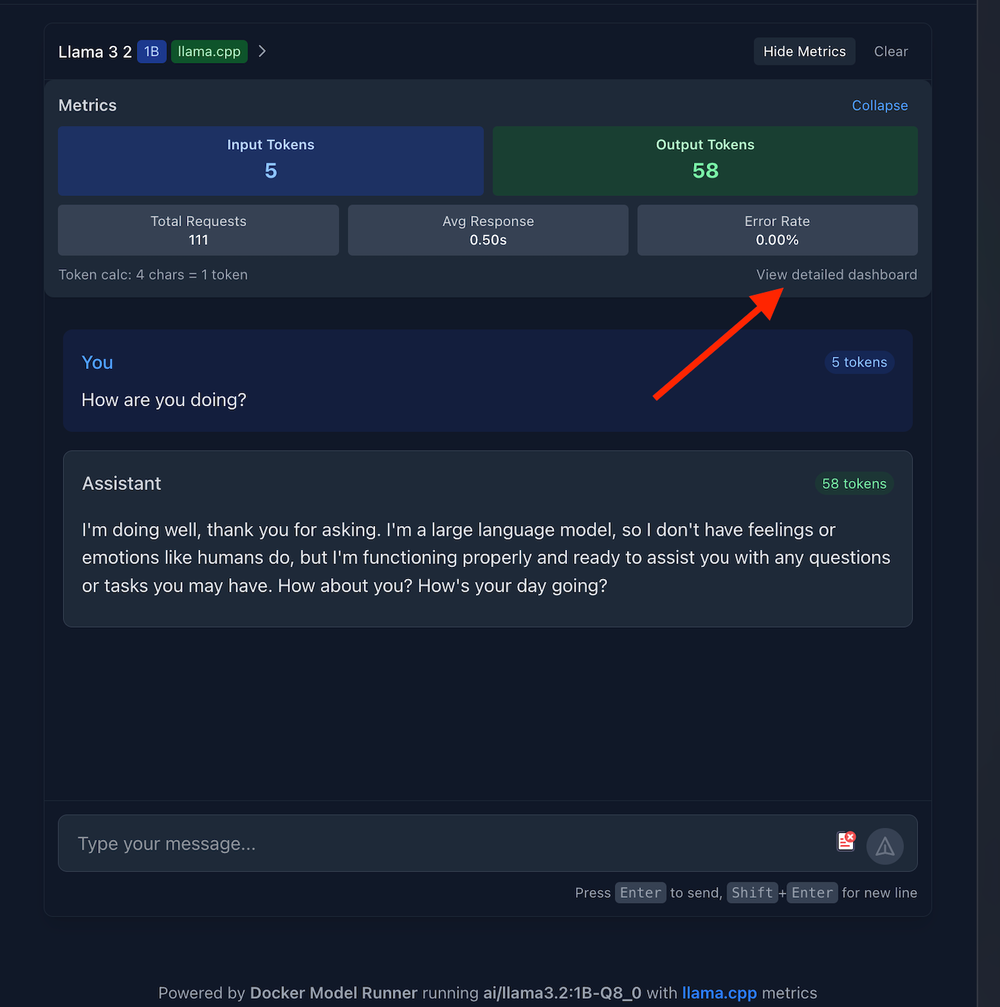
Figure 8: Chat interface showing metrics dashboard with prompt and response plus option to view detailed metrics in Grafana.
Log in with the default credentials (enter “admin” as user and password) to explore pre-configured AI performance dashboards (see screenshot below) showing real-time metrics like tokens per second, memory usage, and model performance.
Select Add your first data source. Choose Prometheus as a data source. Enter “http://prometheus:9090” as Prometheus Server URL. Scroll down to the end of the site and click “Save and test”. By now, you should see “Successfully queried the Prometheus API” as an acknowledgement. Select Dashboard and click Re-import for all these dashboards.
By now, you should have a Prometheus 2.0 Stats dashboard up and running.
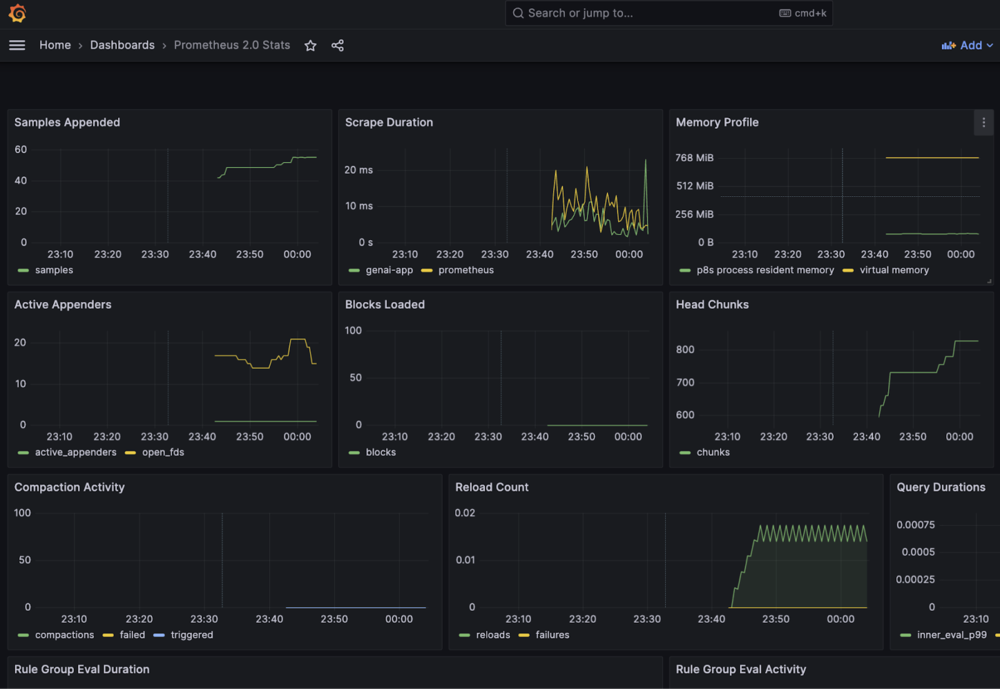
Figure 9: Grafana dashboard with multiple graph panels monitoring GenAI chatbot performance, displaying time-series charts for memory consumption, processing speeds, and application health
Prometheus allows you to collect and store time-series metrics data. Open the Prometheus query interface http://localhost:9091 and start typing “genai” in the query box to explore all available AI metrics (as shown in the screenshot below). You’ll see dozens of automatically collected metrics, including tokens per second, latency measurements, and llama.cpp-specific performance data.
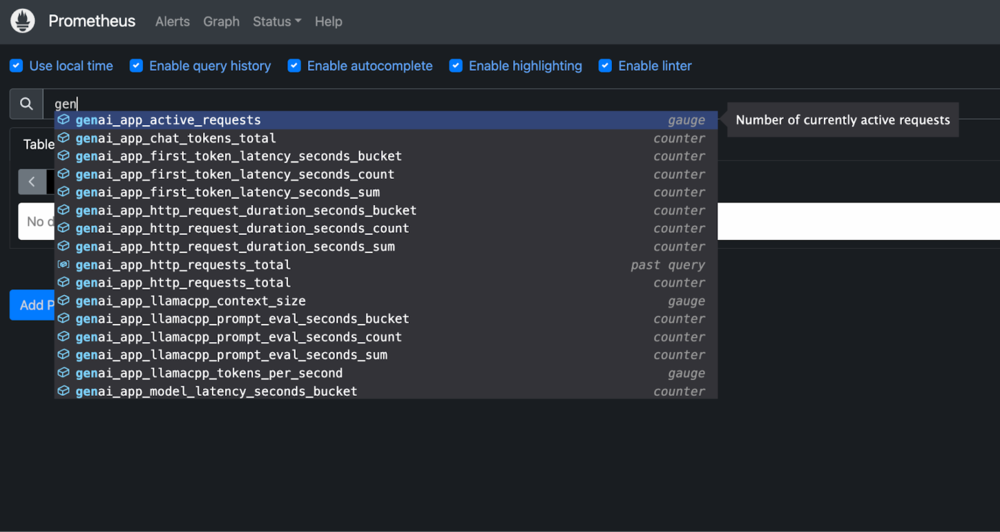
Figure 10: Prometheus web interface showing dropdown of available GenAI metrics including genai_app_active_requests and genai_app_token_latency
Jaeger provides a visual exploration of request flows and performance bottlenecks. You can access it via http://localhost:16686
Implementation details
Let’s explore how the key components of the project work:
- Frontend implementation
The React frontend provides a clean, responsive chat interface built with TypeScript and modern React patterns. The core App.tsx component manages two essential pieces of state: dark mode preferences for user experience and model metadata fetched from the backend’s health endpoint.
When the component mounts, the useEffect hook automatically retrieves information about the currently running AI model. It displays details like the model name directly in the footer to give users transparency about which LLM is powering their conversations.
// Essential App.tsx structure
function App() {
  const [darkMode, setDarkMode] = useState(false);
  const [modelInfo, setModelInfo] = useState<ModelMetadata | null>(null);

  // Fetch model info from backend
  useEffect(() => {
    fetch('http://localhost:8080/health')
      .then(res => res.json())
      .then(data => setModelInfo(data.model_info));
  }, []);

  return (
    <div className="min-h-screen bg-white dark:bg-gray-900">
      <Header toggleDarkMode={() => setDarkMode(!darkMode)} />
      <ChatBox />
      <footer>
        Powered by Docker Model Runner running {modelInfo?.model}
      </footer>
    </div>
  );
}
The main App component orchestrates the overall layout while delegating specific functionality to specialized components like Header for navigation controls and ChatBox for the actual conversation interface. This separation of concerns makes the codebase maintainable while the automatic model info fetching demonstrates how the frontend seamlessly integrates with the Docker Model Runner through the Go backend’s API, creating a unified user experience that abstracts away the complexity of local AI model execution.
- Backend implementation: Integration with Model Runner
The core of this application is a Go backend that communicates with Docker Model Runner. Let’s examine the key parts of our main.go file:
client := openai.NewClient(
    option.WithBaseURL(baseURL),
    option.WithAPIKey(apiKey),
)
This demonstrates how we leverage Docker Model Runner’s OpenAI-compatible API. The Model Runner exposes endpoints that match OpenAI’s API structure, allowing us to use standard clients. Depending on your connection method, baseURL is set to either:
http://model-runner.docker.internal/engines/llama.cpp/v1/(for Docker socket)http://host.docker.internal:12434/engines/llama.cpp/v1/(for TCP)
How metrics flow from host to containers
One key architectural detail worth understanding: llama.cpp runs natively on your host (via Docker Model Runner), while Prometheus and Grafana run in containers. Here’s how they communicate:
The Backend as Metrics Bridge:
- Connects to llama.cpp via Model Runner API (
http://localhost:12434) - Collects performance data from each API call (response times, token counts)
- Calculates metrics like tokens per second and memory usage
- Exposes all metrics in Prometheus format at
http://backend:9090/metrics - Enables containerized Prometheus to scrape metrics without host access
This hybrid architecture gives you the performance benefits of native model execution with the convenience of containerized observability.
LLama.cpp metrics integration
The project provides detailed real-time metrics specifically for llama.cpp models:
|
Metric |
Description |
Implementation in Code |
|---|---|---|
|
Tokens per Second |
Measure of model generation speed |
|
|
Context Window Size |
Maximum context length in tokens |
|
|
Prompt Evaluation Time |
Time spent processing input prompt |
|
|
Memory per Token |
Memory efficiency measurement |
|
|
Thread Utilization |
Number of CPU threads used |
|
|
Batch Size |
Token processing batch size |
|
One of the most powerful features is our detailed metrics collection for llama.cpp models. These metrics help optimize model performance and identify bottlenecks in your inference pipeline.
// LlamaCpp metrics
llamacppContextSize = promautoFactory.NewGaugeVec(
    prometheus.GaugeOpts{
        Name: "genai_app_llamacpp_context_size",
        Help: "Context window size in tokens for llama.cpp models",
    },
    []string{"model"},
)

llamacppTokensPerSecond = promautoFactory.NewGaugeVec(
    prometheus.GaugeOpts{
        Name: "genai_app_llamacpp_tokens_per_second",
        Help: "Tokens generated per second",
    },
    []string{"model"},
)

// More metrics definitions...
These metrics are collected, processed, and exposed both for Prometheus scraping and for real-time display in the front end. This gives us unprecedented visibility into how the llama.cpp inference engine is performing.
Chat implementation with streaming
The chat endpoint implements streaming for real-time token generation:
// Set up streaming with a proper SSE format
w.Header().Set("Content-Type", "text/event-stream")
w.Header().Set("Cache-Control", "no-cache")
w.Header().Set("Connection", "keep-alive")

// Stream each chunk as it arrives
if len(chunk.Choices) > 0 && chunk.Choices[0].Delta.Content != "" {
    outputTokens++
    _, err := fmt.Fprintf(w, "%s", chunk.Choices[0].Delta.Content)
    if err != nil {
        log.Printf("Error writing to stream: %v", err)
        return
    }
    w.(http.Flusher).Flush()
}
This streaming implementation ensures that tokens appear in real-time in the user interface, providing a smooth and responsive chat experience. You can also measure key performance metrics like time to first token and tokens per second.
Performance measurement
You can measure various performance aspects of the model:
// Record first token time
if firstTokenTime.IsZero() && len(chunk.Choices) > 0 &&
chunk.Choices[0].Delta.Content != "" {
    firstTokenTime = time.Now()

    // For llama.cpp, record prompt evaluation time
    if strings.Contains(strings.ToLower(model), "llama") ||
       strings.Contains(apiBaseURL, "llama.cpp") {
        promptEvalTime := firstTokenTime.Sub(promptEvalStartTime)
        llamacppPromptEvalTime.WithLabelValues(model).Observe(promptEvalTime.Seconds())
    }
}

// Calculate tokens per second for llama.cpp metrics
if strings.Contains(strings.ToLower(model), "llama") ||
   strings.Contains(apiBaseURL, "llama.cpp") {
    totalTime := time.Since(firstTokenTime).Seconds()
    if totalTime > 0 && outputTokens > 0 {
        tokensPerSecond := float64(outputTokens) / totalTime
        llamacppTokensPerSecond.WithLabelValues(model).Set(tokensPerSecond)
    }
}
These measurements help us understand the model’s performance characteristics and optimize the user experience.
Metrics collection
The metrics.go file is a core component of our observability stack for the Docker Model Runner-based chatbot. This file defines a comprehensive set of Prometheus metrics that allow us to monitor both the application performance and the underlying llama.cpp model behavior.
Core metrics architecture
The file establishes a collection of Prometheus metric types:
- Counters: For tracking cumulative values (like request counts, token counts)
- Gauges: For tracking values that can increase and decrease (like active requests)
- Histograms: For measuring distributions of values (like latencies)
Each metric is created using the promauto factory, which automatically registers metrics with Prometheus.
Categories of metrics
The metrics can be divided into three main categories:
1. HTTP and application metrics
// RequestCounter counts total HTTP requests
RequestCounter = promauto.NewCounterVec(
    prometheus.CounterOpts{
        Name: "genai_app_http_requests_total",
        Help: "Total number of HTTP requests",
    },
    []string{"method", "endpoint", "status"},
)

// RequestDuration measures HTTP request durations
RequestDuration = promauto.NewHistogramVec(
    prometheus.HistogramOpts{
        Name:    "genai_app_http_request_duration_seconds",
        Help:    "HTTP request duration in seconds",
        Buckets: prometheus.DefBuckets,
    },
    []string{"method", "endpoint"},
)
These metrics monitor the HTTP server performance, tracking request counts, durations, and error rates. The metrics are labelled with dimensions like method, endpoint, and status to enable detailed analysis.
2. Model performance metrics
// ChatTokensCounter counts tokens in chat requests and responses
ChatTokensCounter = promauto.NewCounterVec(
    prometheus.CounterOpts{
        Name: "genai_app_chat_tokens_total",
        Help: "Total number of tokens processed in chat",
    },
    []string{"direction", "model"},
)

// ModelLatency measures model response time
ModelLatency = promauto.NewHistogramVec(
    prometheus.HistogramOpts{
        Name:    "genai_app_model_latency_seconds",
        Help:    "Model response time in seconds",
        Buckets: []float64{0.1, 0.5, 1, 2, 5, 10, 20, 30, 60},
    },
    []string{"model", "operation"},
)
These metrics track the LLM usage patterns and performance, including token counts (both input and output) and overall latency. The FirstTokenLatency metric is particularly important as it measures the time to get the first token from the model, which is a critical user experience factor.
3. llama.cpp specific metrics
// LlamaCppContextSize measures the context window size
LlamaCppContextSize = promauto.NewGaugeVec(
    prometheus.GaugeOpts{
        Name: "genai_app_llamacpp_context_size",
        Help: "Context window size in tokens for llama.cpp models",
    },
    []string{"model"},
)

// LlamaCppTokensPerSecond measures generation speed
LlamaCppTokensPerSecond = promauto.NewGaugeVec(
    prometheus.GaugeOpts{
        Name: "genai_app_llamacpp_tokens_per_second",
        Help: "Tokens generated per second",
    },
    []string{"model"},
)
These metrics capture detailed performance characteristics specific to the llama.cpp inference engine used by Docker Model Runner. They include:
1. Context Size:
It represents the token window size used by the model, typically ranging from 2048 to 8192 tokens. The optimization goal is balancing memory usage against conversation quality. When memory usage becomes problematic, reduce context size to 2048 tokens for faster processing
2. Prompt Evaluation Time
It measures the time spent processing input before generating tokens, essentially your time-to-first-token latency with a target of under 2 seconds. The optimization focus is minimizing user wait time for the initial response. If evaluation time exceeds 3 seconds, reduce context size or implement prompt compression techniques.
3. Tokens Per Second
It measures the time spent processing input before generating tokens, essentially your time-to-first-token latency with a target of under 2 seconds. The optimization focus is minimizing user wait time for the initial response. If evaluation time exceeds 3 seconds, reduce context size or implement prompt compression techniques.
4. Tokens Per Second
It indicates generation speed, with a target of 8+ TPS for good user experience. This metric requires balancing response speed with model quality. When TPS drops below 5, switch to more aggressive quantization (Q4 instead of Q8) or use a smaller model variant.
5. Memory Per Token
It tracks RAM consumption per generated token, with optimization aimed at preventing out-of-memory crashes and optimizing resource usage. When memory consumption exceeds 100MB per token, implement aggressive conversation pruning to reduce memory pressure. If memory usage grows over time during extended conversations, add automatic conversation resets after a set number of exchanges.
6. Threads Used
It monitors the number of CPU cores actively processing model operations, with the goal of maximizing throughput without overwhelming the system. If thread utilization falls below 50% of available cores, increase the thread count for better performance.
7. Batch Size
It controls how many tokens are processed simultaneously, requiring optimization based on your specific use case balancing latency versus throughput. For real-time chat applications, use smaller batches of 32-64 tokens to minimize latency and provide faster response times.
In nutshell, these metrics are crucial for understanding and optimizing llama.cpp performance characteristics, which directly affect the user experience of the chatbot.
Docker Compose: LLM as a first-class service
With Docker Model Runner integration, Compose makes AI model deployment as simple as any other service. One docker-compose.yml file defines your entire AI application:
- Your AI models (via Docker Model Runner)
- Application backend and frontend
- Observability stack (Prometheus, Grafana, Jaeger)
- All networking and dependencies
The most innovative aspect is the llm service using Docker’s model provider, which simplifies model deployment by directly integrating with Docker Model Runner without requiring complex configuration. This composition creates a complete, scalable AI application stack with comprehensive observability.
  llm:
    provider:
      type: model
      options:
        model: ${LLM_MODEL_NAME:-ai/llama3.2:1B-Q8_0}
This configuration tells Docker Compose to treat an AI model as a standard service in your application stack, just like a database or web server.
- The
providersyntax is Docker’s new way of handling AI models natively. Instead of building containers or pulling images, Docker automatically manages the entire model-serving infrastructure for you. - The
model: ${LLM_MODEL_NAME:-ai/llama3.2:1B-Q8_0}line uses an environment variable with a fallback, meaning it will use whatever model you specify inLLM_MODEL_NAME, or default to Llama 3.2 1B if nothing is set.
|
Docker Compose: One command to run your entire stack |
|---|
|
Why is this revolutionary? Before this, deploying an LLM required dozens of lines of complex configuration – custom Dockerfiles, GPU device mappings, volume mounts for model files, health checks, and intricate startup commands. Now, those four lines replace all of that complexity. Docker handles downloading the model, configuring the inference engine, setting up GPU access, and exposing the API endpoints automatically. Your other services can connect to the LLM using simple service names, making AI models as easy to use as any other infrastructure component. This transforms AI from a specialized deployment challenge into standard infrastructure-as-code. |
Here’s the full compose.yml file that orchestrates the entire application:
 services:
  backend:
    env_file: 'backend.env'
    build:
      context: .
      target: backend
    ports:
      - '8080:8080'
      - '9090:9090'  # Metrics port
    volumes:
      - /var/run/docker.sock:/var/run/docker.sock  # Add Docker socket access
    healthcheck:
      test: ['CMD', 'wget', '-qO-', 'http://localhost:8080/health']
      interval: 3s
      timeout: 3s
      retries: 3
    networks:
      - app-network
    depends_on:
      - llm

  frontend:
    build:
      context: ./frontend
    ports:
      - '3000:3000'
    depends_on:
      backend:
        condition: service_healthy
    networks:
      - app-network

  prometheus:
    image: prom/prometheus:v2.45.0
    volumes:
      - ./prometheus/prometheus.yml:/etc/prometheus/prometheus.yml
    command:
      - '--config.file=/etc/prometheus/prometheus.yml'
      - '--storage.tsdb.path=/prometheus'
      - '--web.console.libraries=/etc/prometheus/console_libraries'
      - '--web.console.templates=/etc/prometheus/consoles'
      - '--web.enable-lifecycle'
    ports:
      - '9091:9090'
    networks:
      - app-network

  grafana:
    image: grafana/grafana:10.1.0
    volumes:
      - ./grafana/provisioning:/etc/grafana/provisioning
      - grafana-data:/var/lib/grafana
    environment:
      - GF_SECURITY_ADMIN_PASSWORD=admin
      - GF_USERS_ALLOW_SIGN_UP=false
      - GF_SERVER_DOMAIN=localhost
    ports:
      - '3001:3000'
    depends_on:
      - prometheus
    networks:
      - app-network

  jaeger:
    image: jaegertracing/all-in-one:1.46
    environment:
      - COLLECTOR_ZIPKIN_HOST_PORT=:9411
    ports:
      - '16686:16686'  # UI
      - '4317:4317'    # OTLP gRPC
      - '4318:4318'    # OTLP HTTP
    networks:
      - app-network

  # New LLM service using Docker Compose's model provider
  llm:
    provider:
      type: model
      options:
        model: ${LLM_MODEL_NAME:-ai/llama3.2:1B-Q8_0}

volumes:
  grafana-data:

networks:
  app-network:
    driver: bridge
This compose.yml defines a complete microservices architecture for the application with integrated observability tools and Model Runner support:
backend
- Go-based API server with Docker socket access for container management
- Implements health checks and exposes both API (8080) and metrics (9090) ports
frontend
- React-based user interface for an interactive chat experience
- Waits for backend health before starting to ensure system reliability
prometheus
- Time-series metrics database for collecting and storing performance data
- Configured with custom settings for monitoring application behavior
grafana
- Data visualization platform for metrics with persistent dashboard storage
- Pre-configured with admin access and connected to the Prometheus data source
jaeger
- Distributed tracing system for visualizing request flows across services
- Supports multiple protocols (gRPC/HTTP) with UI on port 16686
How Docker Model Runner integration works
The project integrates with Docker Model Runner through the following mechanisms:
- Connection Configuration:
- Using internal DNS:
http://model-runner.docker.internal/engines/llama.cpp/v1/ - Using TCP via host-side support:
localhost:12434
- Using internal DNS:
- Docker’s Host Networking:
- The
extra_hostsconfiguration mapshost.docker.internalto the host’s gateway IP
- The
- Environment Variables:
BASE_URL: URL for the model runnerMODEL: Model identifier (e.g.,ai/llama3.2:1B-Q8_0)
- API Communication:
- The backend formats messages and sends them to Docker Model Runner
- It then streams tokens back to the frontend in real-time
Why this approach excels
Building GenAI applications with Docker Model Runner and comprehensive observability offers several advantages:
- Privacy and Security: All data stays on your local infrastructure
- Cost Control: No per-token or per-request API charges
- Performance Insights: Deep visibility into model behavior and efficiency
- Developer Experience: Familiar Docker-based workflow with powerful monitoring
- Flexibility: Easy to experiment with different models and configurations
Conclusion
The genai-model-runner-metrics project demonstrates a powerful approach to building AI-powered applications with Docker Model Runner while maintaining visibility into performance characteristics. By combining local model execution with comprehensive metrics, you get the best of both worlds: the privacy and cost benefits of local execution with the observability needed for production applications.
Whether you’re building a customer support bot, a content generation tool, or a specialized AI assistant, this architecture provides the foundation for reliable, observable, and efficient AI applications. The metrics-driven approach ensures you can continuously monitor and optimize your application, leading to better user experiences and more efficient resource utilization.
Ready to get started? Clone the repository, fire up Docker Desktop, and experience the future of AI development — your own local, metrics-driven GenAI application is just a docker compose up away!
Learn more
- Read our quickstart guide to Docker Model Runner.
- Find documentation for Model Runner.
- Subscribe to the Docker Navigator Newsletter.
- New to Docker? Create an account.
- Have questions? The Docker community is here to help.

