- Arc reinvented browsing for the better - and that was apparently the problem
- Why I prefer this rugged Samsung phone over flagship models (and it looks just as good)
- Can a home wind turbine replace my solar panels? My results after months of testing
- DragonForce Ransomware Leveraged in MSP Attack Using RMM Tool
- Learn with Cisco: Evolving for the Age of AI, Automation, and Cloud
Relevant and Extended Detection with SecureX, Part Three: Behaviour-Based Detections with Secure Network Analytics – Cisco Blogs

In part one of this Relevant and Extended Detection with SecureX series, we introduced the notion of risk-based extended detection with Cisco SecureX – the idea that a user can prioritise detections into incidents based on their idea of what constitutes risk in their environments and then extend those detections with enrichments from other products. In subsequent posts we are diving deeper into different Cisco Secure detection technologies and how their respective detections can be prioritised, promoted to SecureX as incidents and extended. In this post we will look at detections from Cisco Secure Network Analytics to uncover what exactly a network behaviour-based detection is, what makes them relevant and important, when/how to promote them to SecureX as incidents, and how to leverage and extend the detections in SecureX.
What Makes a Network Behaviour Detection?
If you’ve attended BRKSEC-3014 at any Cisco Live in the past, you’ll know this is one of my favourite topics: behavioural observations describe that a specific behaviour was observed and as such are a statement of fact – ex. “This host has been observed to have High Traffic.” The usual language in security operations – True Positive, False Positive, True Negative, False Negative – can’t be used to accurately classify a behavioural observation (by definition, everything is a true positive) and we must approach them with a slightly different mindset than we would a content derived detection.
A behaviour analytic product, like Cisco Secure Network Analytics, collects data, analyses it and when the conditions for a given algorithm, or behavioural model are met, generate a detection. I tend to separate the detections generated into two buckets:
1. Observation of a known behavioural condition
An algorithm watches for a known behaviour pattern and alarms when the conditions are met. A very simple example is communication to a known command and control server, a more complex example is a host is downloading a large amount of data.
2. An anomaly observation
A definition of normal is established and when the conditions for a deviation from that normal is met an alarm generates. This event is harder to classify, oftentimes the model of normal is built based on some of the similar behaviour conditions above and alarm on a deviation, for example “a host is downloading an abnormal amount of data.”
The thing that makes operationalising behaviour observations tricky is that the detections themselves do not capture intent: you often must overlay intent using the language of the business and its relevance to the behavioural observation. For example “the PCI server just uploaded a lot of data to an external server” is very different than “10.10.10.10 just uploaded a lot of data to 128.107.78.10.” Just identifying a behaviour doesn’t necessarily mean it was a bad behaviour and just identifying an anomaly doesn’t necessarily mean that it is an insidious threat. There’s a lot of weird out there, and some of it means nothing.
.
The process of choosing which observations and alarms are some of the most valuable and actionable is beyond the scope of this blog series, however, several tools and techniques have been documented over the years and different methodologies developed to show how to best operationalise behavioural observations from Cisco Secure Network Analytics. If you haven’t already, and you’re interested in understanding the analytics engine, I would suggest viewing past recordings of BRKSEC-3014 and the Phased Approach to Tuning is always worth a read.
Creating an Incident from a Secure Networks Analytics Observation
One approach that takes the context of the business into the generation of alarms is the Tiered Alarm approach; which also lends itself perfectly to the promotion of incidents into SecureX threat response . In the tiered alarm approach to tuning alarms, active alarms in Secure Network Analytics are configured to three tiers:
- Severity Critical – Well-tuned, well-understood, typically low volume and highly actionable
- Severity Major – of interest and are tuned, observed, and documented
- Severity Minor – Mostly informational; not necessarily actionable on their own, but useful for context
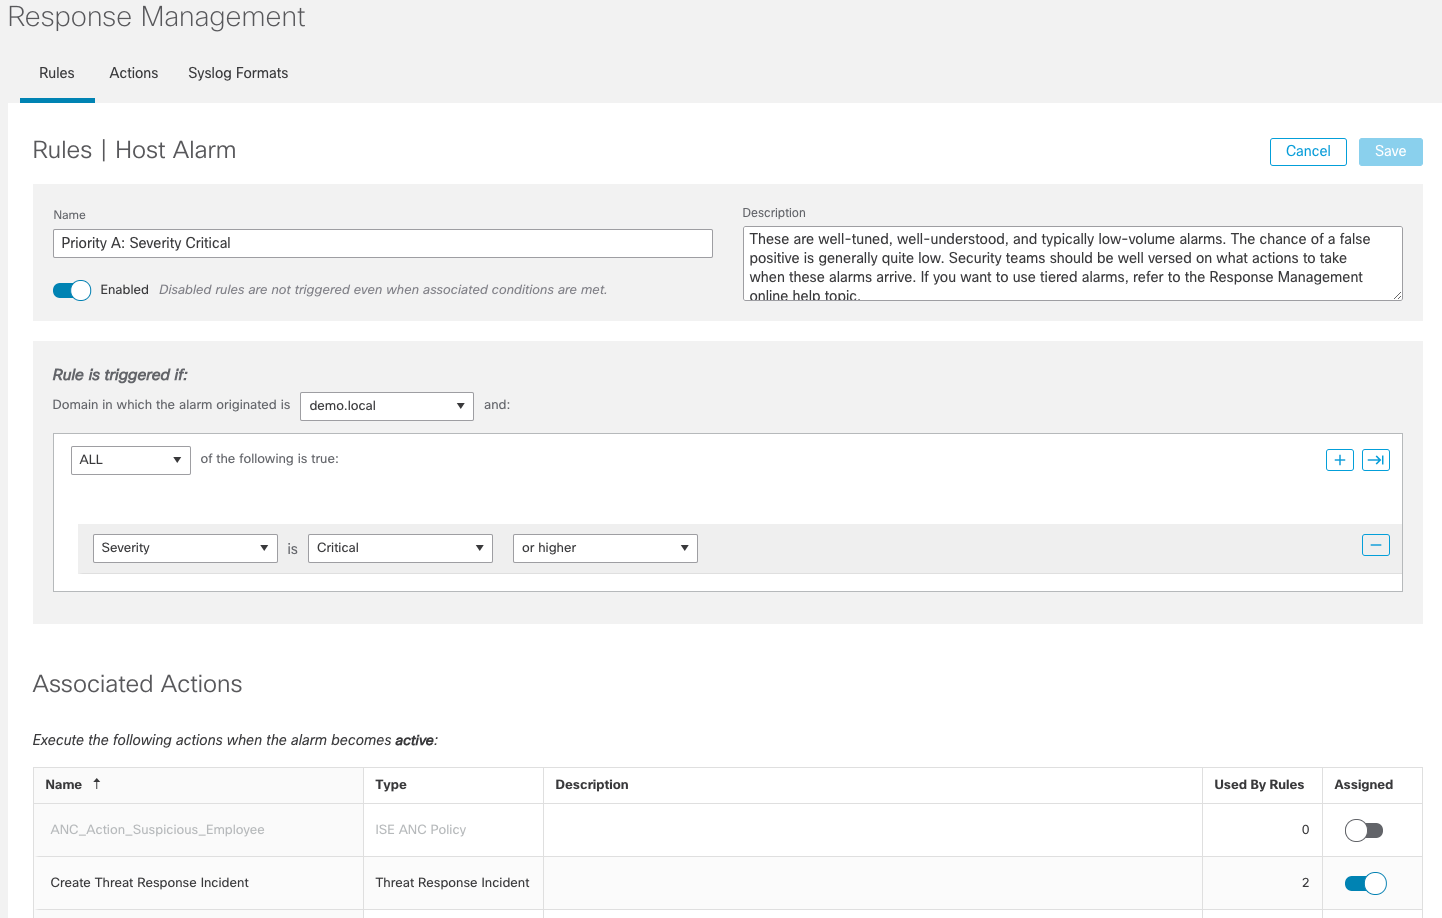
When using the Tiered Alarm approach, after deciding what are the most important alarms to your security operations center, you set their severity to critical – and these are the ones that you build a response playbook around. It also happens that Cisco Secure Network Analytics uses the severity setting as criteria for promotion of alarms to Cisco SecureX threat response as incidents. In order to automatically promote an alarm to SecureX threat response simply set its criteria to critical and in the Response Management configuration for the built-in rule Priority A: Severity Critical enable the built-in Create Threat Response Incident action. If you wanted to also promote the High Severity detections as incidents, you can do the same with the built in Priority B: Severity High rule.

Once promoted into SecureX threat response as an incident you can begin to extend the incident using the features of threat response and the incident manager as discussed in Part one. For example, in the below figure, we can see the occurrence of the alarm CSE: Employees to Bottling Line, and we are examining the observables in the incident .
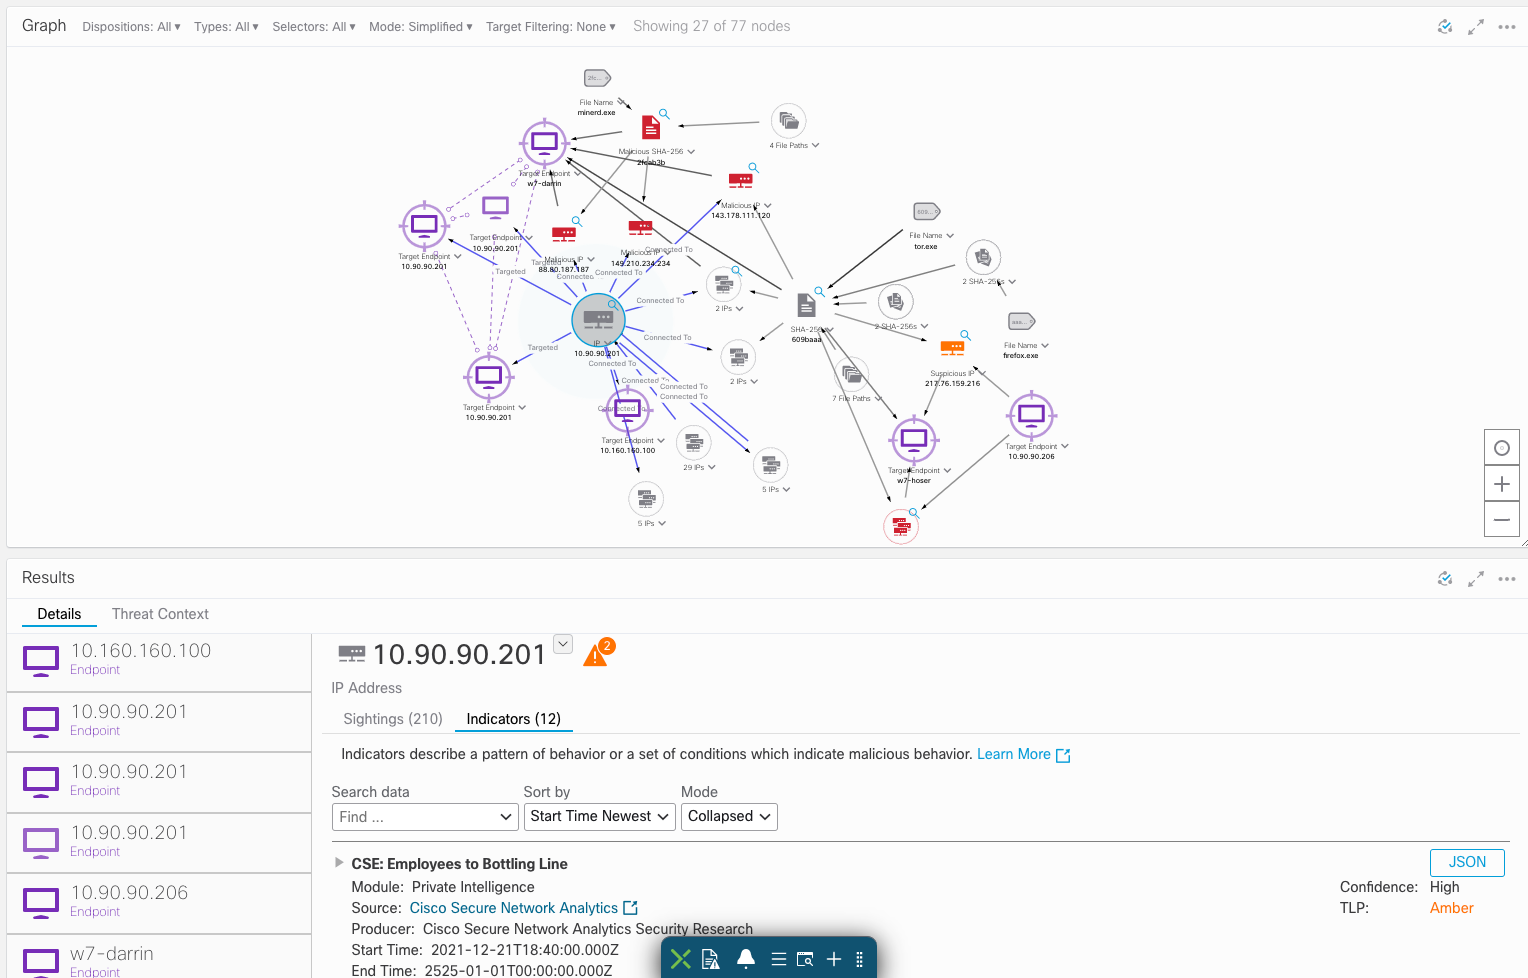
Clicking Investigate Incident will launch an investigation, extending the incident with relevant information about those observables by querying the APIs of integrated products to find what those products know about the observables. The investigation of the above incident results in the below figure where we can see additional context. Of interest here is that there are multiple different incidents from Secure Network Analytics associated with the IP Address involved (bottom left of the figure). We are also able to observe the target endpoint involved has the hostname w7-darrin (top left of the graph).

You might notice the groupings of 8 IPs, 4 IPs and 27 IPs – when it comes to data from Secure Network Analytics every edge in the graph is a behaviour observation (Security Event in Secure Network Analytics nomenclature – these are observations that are being made but not necessarily alarms).
Leveraging this knowledge about how SecureX threat response displays data from Secure Network Analytics, we’re going to return to the incident from Part Two; the automatically created and enriched, high severity incident involving the host w7-darrin. Opening the snapshot of the incident and adding the IP Address 10.90.90.201 results in the view below.

At this point we’ve significantly extended the incident to include data not only from the original incident but more completely brought in data from Secure Network Analytics. What started as a High Impact incident, largely driven by endpoint severity settings (in this case the use of tor.exe) led to a picture with greater context of a host that is using banned software (tor.exe), actively cryptomining and for some unknown reason violating network security policy by connecting over RDP to the production bottling line. The volume of infractions shown in one screen is quite incriminating.
One of the great advantages of Secure Network Analytics is the wealth of network data it holds – a record of every conversation on the network – and while that can be a lot of data and you don’t always know what you’re looking for, the Security Events (or behaviour observations) generated by Secure Network Analytics help to tell you where to look. When combined with a High Impact detection from Secure Endpoint what might have been overlooked behaviour observations suddenly become much more relevant, allowing the operator to shorten that OODA loop and make decisions and take actions quicker and with greater efficiency.
In this post we’ve reviewed some concepts behind what makes a behaviour detection, why they’re valuable, how to leverage Cisco SecureX to automatically extend the detection, and how to use the behaviour observations to enrich and extend incidents from other detection products. In the next post in this series, we will continue this effort of extended detection with the automatic promotion and triaging of behaviour detections from Cisco Secure Cloud Analytics into Cisco SecureX.
Interested in seeing Cisco Secure Network Analytics and the SecureX Incident Manager in action? Activate your SecureX account now.
We’d love to hear what you think. Ask a Question, Comment Below, and Stay Connected with Cisco Secure on social!
Cisco Secure Social Channels
Instagram
Facebook
Twitter
LinkedIn
Share:

