- Tigera extends cloud-native networking with Calico 3.30
- My favorite headphones for watching TV and movies are on sale at their lowest price
- Treat your transformation like a merger
- These Shokz earbuds easily replaced my Bose Ultra Open, and for a fraction of the price
- US House Passes Bill to Assess Threats Posed by Foreign Routers
Shorter Feedback Loops Developing Java Apps with Digma’s Free Docker Extension Shorter Feedback Loops Developing Java Apps with Digma’s Free Docker Extension
Many engineering teams follow a similar process when developing Docker images. This process encompasses activities such as development, testing, and building, and the images are then released as the subsequent version of the application. During each of these distinct stages, a significant quantity of data can be gathered, offering valuable insights into the impact of code modifications and providing a clearer understanding of the stability and maturity of the product features.
Observability has made a huge leap in recent years, and advanced technologies such as OpenTelemetry (OTEL) and eBPF have simplified the process of collecting runtime data for applications. Yet, for all that progress, developers may still be on the fence about whether and how to use this new resource. The effort required to transform the raw data into something meaningful and beneficial for the development process may seem to outweigh the advantages offered by these technologies.
The practice of continuous feedback envisions a development flow in which this particular problem has been solved. By making the evaluation of code runtime data continuous, developers can benefit from shorter feedback loops and tighter control of their codebase. Instead of waiting for issues to develop in production systems, or even surface in testing, various developer tools can watch the code observability data for you and provide early warning and rigorous linting for regressions, code smells, or issues.
At the same time, gathering information back into the code from multiple deployment environments, such as the test or production environment, can help developers understand how a specific function, query, or event is performing in the real world at a single glance.
Meet Digma, the first linter for your runtime data
Digma is a free developer tool that was created to bridge the continuous feedback gap in the DevOps loop. It aims to make sense of the gazillion metrics traces and logs the code is spewing out — so that developers won’t have to. And, it does this continuously and automatically.
To make the tool even more practical, Digma processes the observability data and uses it to lint the source code itself, right in the IDE. From a developer’s perspective, this means a whole new level of information about the code is revealed — allowing for better code design based on real-world feedback, as well as quick turnaround for fixing regression or avoiding common pitfalls and anti-patterns.
How Digma is deployed
Digma is packaged as a self-contained Docker extension to make it easy for developers to evaluate their code without registration to an external service or sharing any data that might not be allowed by corporate policy (Figure 1). As such, Digma acts as your own intelligent agent for monitoring code execution, especially in development and testing. The backend component is able to track execution over time and highlight any inadvertent changes to behavior, performance, or error patterns that should be addressed.
To collect data about the code, behind the scenes Digma leverages OpenTelemetry, a widely used open standard for modern observability. To make getting started easier, Digma takes care of the configuration work for you, so from the developer’s point of view, getting started with continuous feedback is equivalent to flipping a switch.
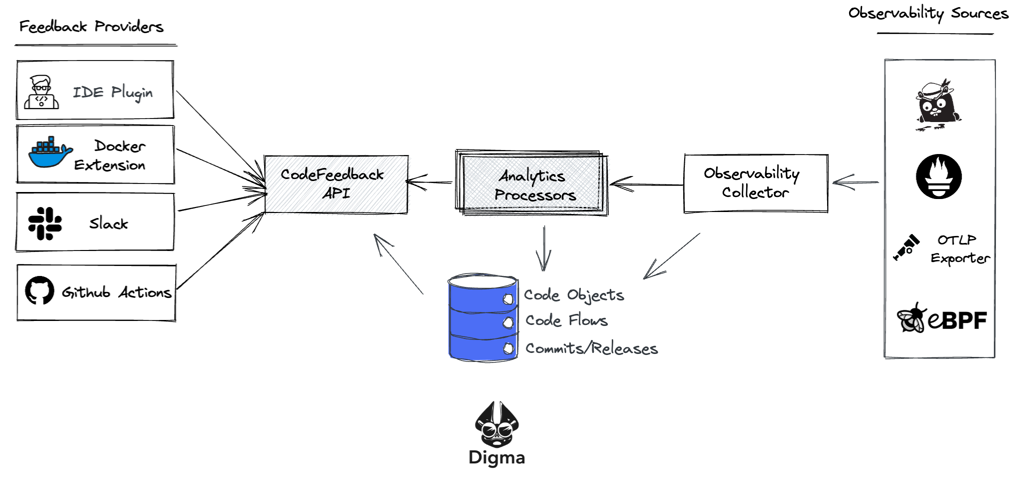
Once the information is collected using OTEL, Digma runs it through what could be described as a reverse pipeline, aggregating the data, analyzing it and providing it via an API to multiple outlets including the IDE plugin, Jaeger, and the Docker extension dashboard that we’ll describe in this example.
Note: Currently, Digma supports Java applications running on IntelliJ IDEA; however, support for additional languages and platforms will be rolling out in the coming months.
Installing Digma
Prerequisites: Docker Desktop 4.8 or later.
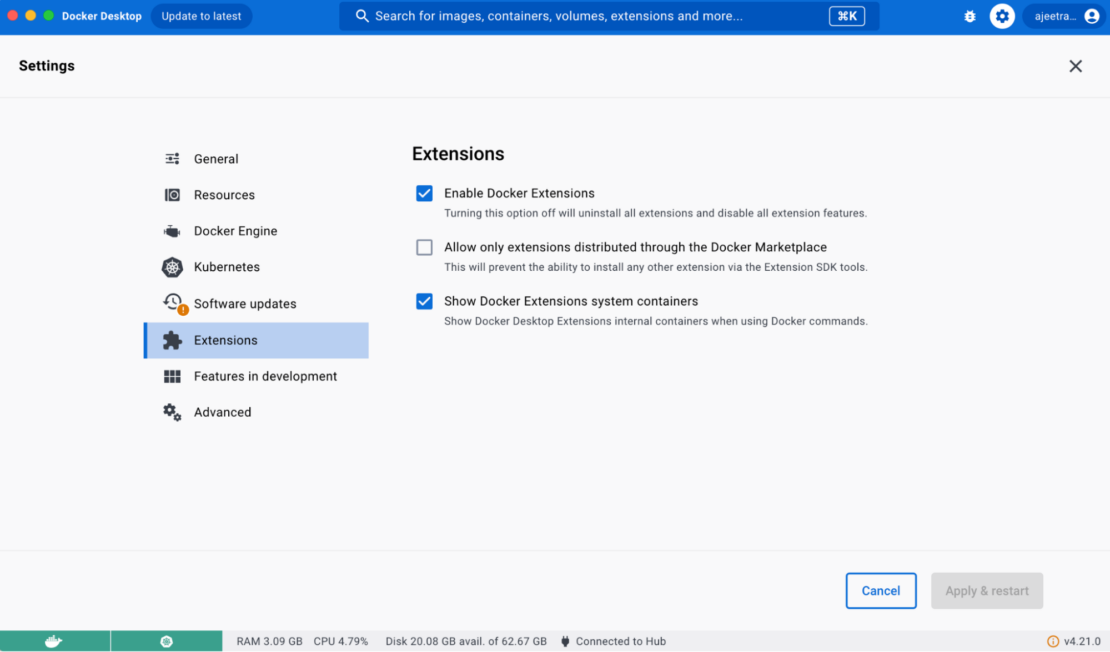
Note: You must ensure that the Docker Extension is enabled (Figure 2).
Step 1. Installing the Digma Docker Extension
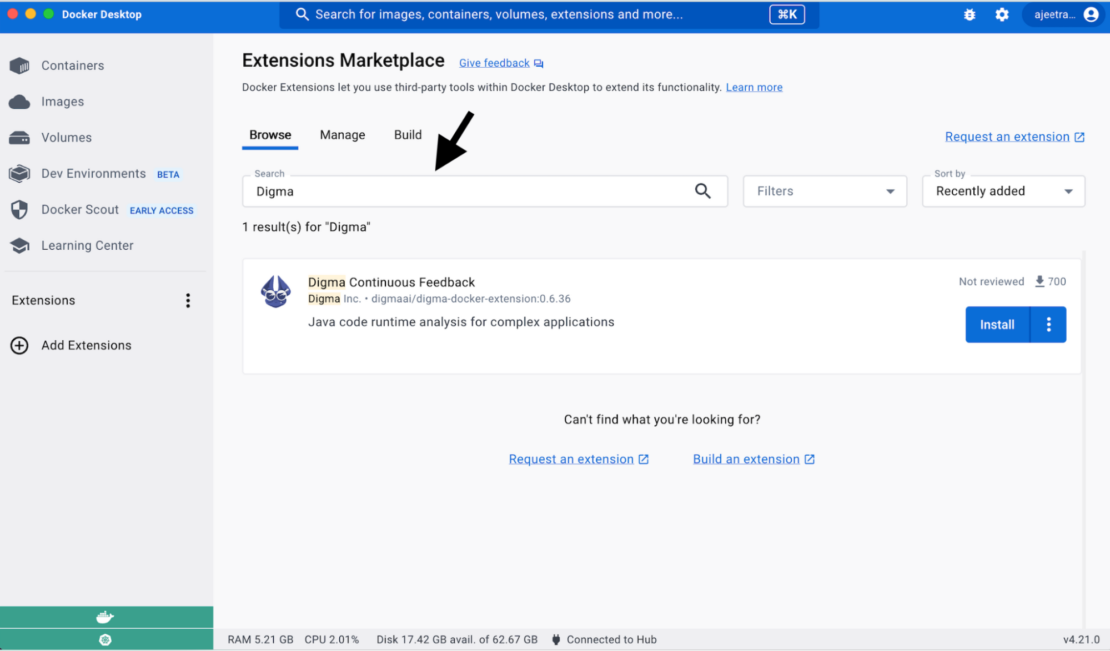
In the Extensions Marketplace, search for Digma and select Install (Figure 3).
Step 2. Collecting feedback about your code
After installing the Digma extension from the marketplace, you’ll be directed to a quickstart page that will guide you through the next steps to collect feedback about your code. Digma can collect information from two different sources:
- Your tests/debug sessions within the IDE
- Any Docker containers you may have running in Docker desktop
Getting feedback while debugging/running code in the IDE
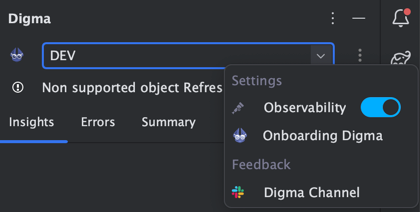
Digma’s IDE extension makes the process of collecting data about your code in the IDE trivial. The entire setup is reduced to a single toggle button click (Figure 4). Behind the scenes, Digma adds variables to the runtime configuration, so that it uses OpenTelemetry for observability. No prior knowledge or observability is needed, and no code changes are necessary to get this to work.
With the observability toggle enabled, you’ll start getting immediate feedback as you run your code locally, or even when you execute your tests. Digma will be on the lookout for any regressions and will automatically spot code smells and issues.
Getting feedback from running containers
In addition to the IDE, you can also choose to collect data from any running container on your machine running Java code. The process to do that is extremely simple and also documented in the Digma extension Getting Started page. It does not involve changing any Dockerfile or code. Basically, you download the OTEL agent, mount it to a volume on the container, and set some environment variables that point the Java process to use it.
curl --create-dirs -O -L --output-dir ./otel
https://github.com/open-telemetry/opentelemetry-java-instrumentation/releases/latest/download/opentelemetry-javaagent.jar

curl --create-dirs -O -L --output-dir ./otel
https://github.com/digma-ai/otel-java-instrumentation/releases/latest/download/digma-otel-agent-extension.jar

export JAVA_TOOL_OPTIONS="-javaagent:/otel/javaagent.jar -Dotel.exporter.otlp.endpoint=http://localhost:5050 -Dotel.javaagent.extensions=/otel/digma-otel-agent-extension.jar"
export OTEL_SERVICE_NAME={--ENTER YOUR SERVICE NAME HERE--}
export DEPLOYMENT_ENV=LOCAL_DOCKER

docker run -d -v "/$(pwd)/otel:/otel" --env JAVA_TOOL_OPTIONS --env OTEL_SERVICE_NAME --env DEPLOYMENT_ENV {-- APPEND PARAMS AND REPO/IMAGE --}
Uncovering how the code behaves in runtime
Whether you collect data from running containers or in the IDE, Digma will continuously analyze the code behavior and make the analysis results available both as code annotations in the IDE and as dashboards in the Digma extension itself. To demonstrate a live example, we’ve created a sample application based on the Java Spring Boot PetClinic app.
In this scenario, we’ll clone the repo and run the code from the IDE, triggering a few actions to see what they reveal about the code. For convenience, we’ve created run configurations to simulate common API calls and create interesting data:
- Open the PetClinic project here in your IntelliJ IDE.
- Run the petclinic-service configuration.
- Access the API and play around with it on http://localhost:9753/ or simply run the ClientTested run config included in the workspace.
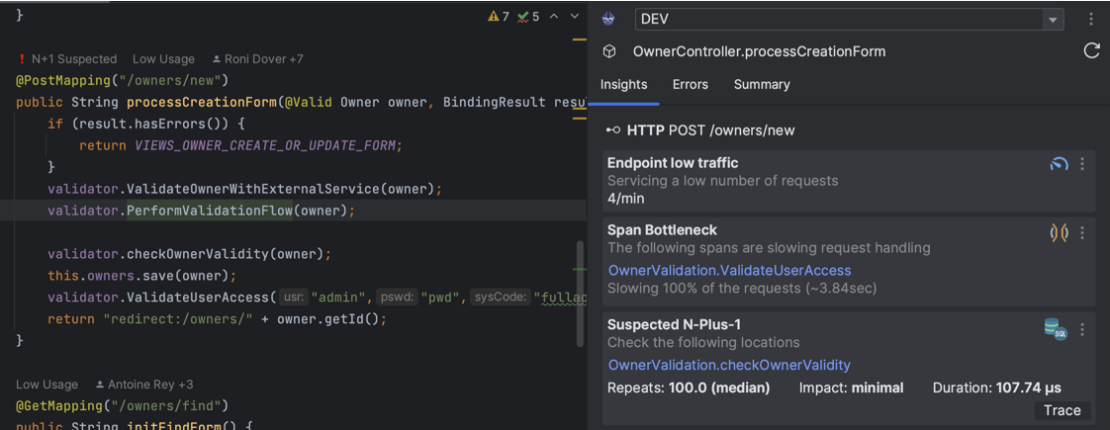
Almost immediately, the result of the dynamic linting analysis will start appearing over the code in the IDE (Figure 5):
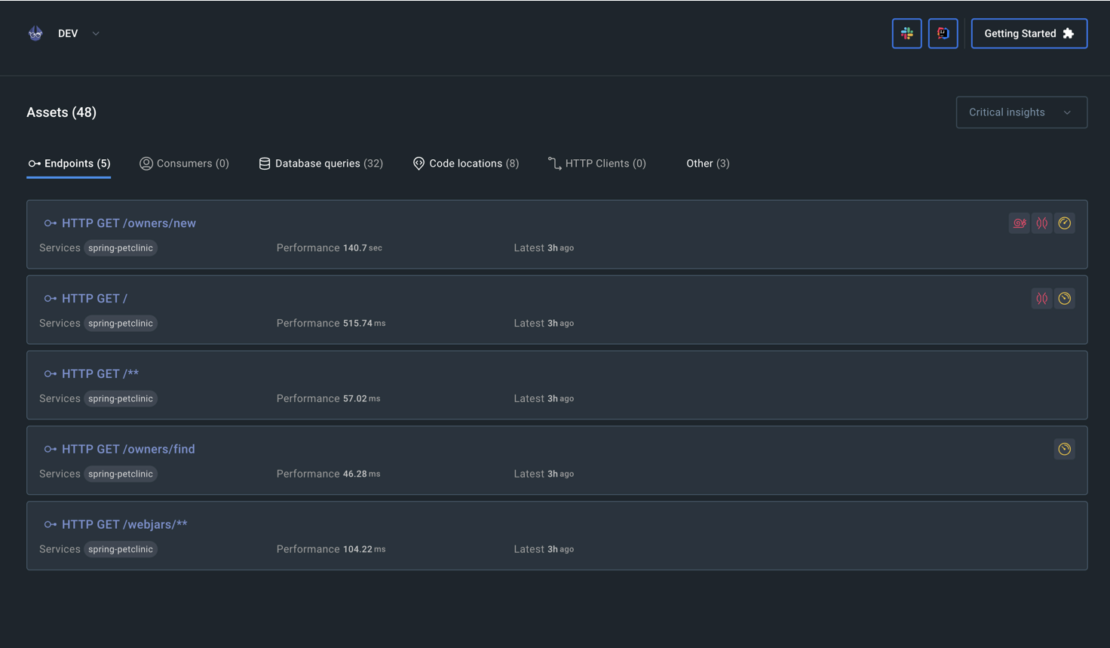
At the same time, the Digma extension itself will present a dashboard cataloging all of the assets that have been identified, including code locations, API endpoints, database queries, and more (Figure 6). For each asset, you’ll be able to access basic statistics about its performance as well as a more detailed list of issues of concern that may need to be tracked about their runtime behavior.
Using the observability data
One of the main problems Digma tries to solve is not how to collect observability data but how to turn it into a useful and practical asset that can speed up development processes and improve the code. Digma’s insights can be directly applied during design time, based on existing data, as well as to validate changes as they are being run in dev/test/prod and to get early feedback and shorter loops into the development process.
Examples of design time planning code insights:
- See runtime usage for the modified functions and understand who will be affected by the change
- Concurrency to plan for, bottlenecks and criticality
- Existing errors and exceptions that need to be handled by the new component
- See complete visualization of the flow of control using the modified code
Examples of runtime code validations for shorter feedback loops:
- Catch code and query modeling smells, such as N+1 Selects, are detected and highlighted
- Identify new performance bottlenecks and regressions as a result of the changes
- Spot scaling issues earlier and address them as a part of the dev cycle
As Digma evolves, it continues to track and provide clear visibility into specific areas that are important to developers with the goal of having complete clarity about how each piece of code is behaving in real-world scenarios and catching issues and regressions much earlier in the process.
Who should use Digma?
Unlike many other observability solutions, Digma is code first and developer first. Digma is completely free for developers, does not require any code changes or sharing data, and will get you from zero to impactful data about your code within minutes. If you are working on Java code, use the JetBrains IDE, and you want to improve your code with actual execution data, you can get started by picking up the Digma extension from the marketplace.
You can provide feedback in our Slack channel and tell us where Digma improved your dev cycle.

