- Apple's latest iPad Mini model has hit its lowest price of the year
- This OnePlus tablet handles movies and entertainment better than iPads (it's also on sale)
- The Samsung phone I recommend to most people is not a flagship (and it's on sale)
- Don't ignore this troubling metric that your smart air purifier tracks - here's why
- I replaced my $3,500 Sony camera with a 200MP Android phone - and the results caught me off guard
vRealize Operations – AIOps with vRealize (Part 3)

As we continue this series, we have been looking at how the speed of business in today’s global market is continually increasing due to digitization. This is driving massive application growth, leading to more disparate technologies, more complexity across environments, poor visibility, difficulties resolving issues and a range of other challenges.
IT Operations are pushed to breaking point. AIOps can help with machine learning & big data, dramatically enhancing IT Operations, with continuous insight across clouds.
What are the basics we expect from any monitoring platform? I would argue the following minimum attributes:
Discover, collect, and persist the following data types: metrics, events, configurations, and logs.
Getting these basics right is key. Next up is the user experience. We’ve all loaded up a data visualization platform and been overwhelmed with the graphs and the metrics. Soon everything shows red, usually due to the lack of configuration and tweaking to your needs. Eventually you might just stop using the platform, the data in there is useless, with no meaning or relation to business needs.
Around the cycle we go again, but maybe next time when you look at monitoring, you implement an open-source option. Fully extensible, but it could burn through a lot of internal engineering cycles building the functionality you need. Again, the outcome will probably be the same. Another system deployed, eating up valuable compute and storage, not being used.
So where are we going with this? Simply, we need to expect more from our monitoring solutions. Once deployed, it should be easy to connect to our platforms and endpoints we want to monitor. We should be able to configure a few basic settings, and let the system draw in the metrics from our systems. Analyze those data points, baseline, and start to offer smart recommendations, through the likes of dynamic thresholds.
Example:
Monitoring platform baselines that Web-Server-01 runs at 45% CPU utilization between 11pm-8am, and 65% between 8am and 11pm.
If the platform sees the utilization is running at 85% utilization at 3am, Alert and Notify.
Now let’s dive into how vRealize Operations can enhance your world by allowing you to expect more from a monitoring platform.
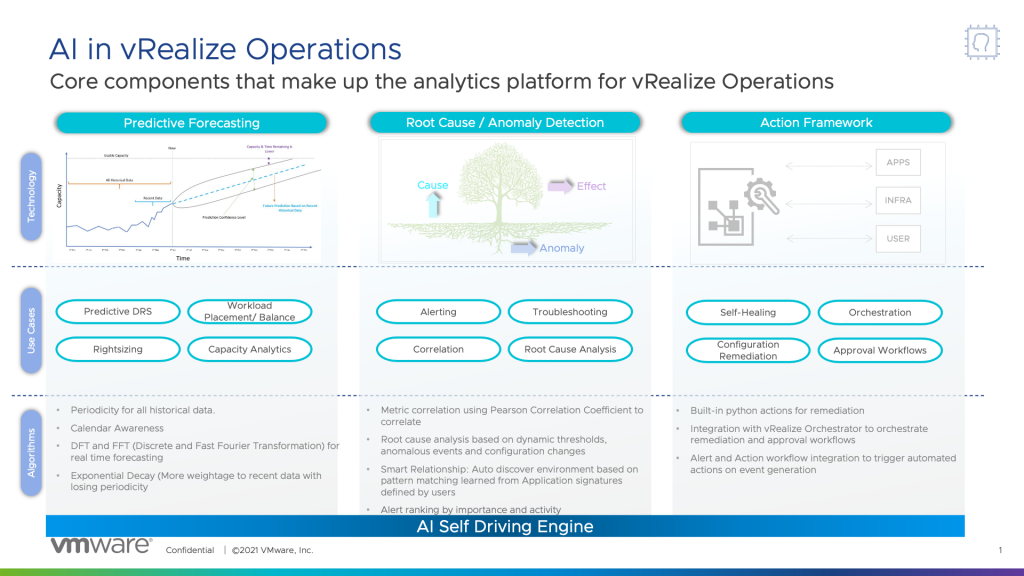
VMware vRealize Operations provides full stack visibility across datacenters and clouds, from the physical infrastructure, through the virtualization later and right up into the guest to the applications themselves. It pulls in metrics from across your IT estate. The vRealize Operations platform leverages machine learning to provide intelligent remediation of issues and proactive planning to avoid any challenges around capacity management, costs, and compliance.
The focus of features and development across the platform spans four major pillars:
Continuous Performance Optimization
Predictive analytics to balance workloads, optimize, and right size workloads. Ensuring applications continually run smoothly and perform optimally.
Efficient Capacity and Cost Management
Machine learning based capacity and cost analytics, ensuring the optimal density and performance per dollar.
Integrated Compliance
Reduce risk and enforce IT regulatory standards for VMware Cloud with integrated compliance and automated drift remediation. Ensure your environment’s adherence to common regulatory standards with six out-of-the-box compliance templates—including those for PCI, HIPAA or SOX—or create your own custom templates.
Intelligent Remediation
Predict, prevent, and troubleshoot issues faster with actionable insights and predictive analytics. Correlate metrics and logs with unified visibility from apps to infrastructure for VMs and Kubernetes workloads. Accelerate anomaly detection and root cause analysis with smart application topology, metric correlation, and artificial intelligence (AI).
Following from the first introduction article, which focused on introducing the concepts of AIOps into your environments to assist with monitoring, alerting and problem resolution. We will stick with the three areas discussed, so we can delve into some technical features of vRealize Operations.

Making sense of the data you are collecting is the number one goal of any monitoring platform. But displaying the data is not enough.
For as long as I can remember, vRealize Operations has nailed the predictive forecasting feature. Analyzing the historical data, creating a trend, and giving you a prediction on the future capacity and performance usage. Using your own created views and dashboards, you could even predict the number of VMs created in your platform if you wanted.
Applying machine learning to this collected data, leads into right sizing your deployments. Helping you to answer queries such as “How do I ensure that HR’s Application and Database are getting the right number of resources without impeding other services?”.
Next is understanding where in your datacenter your workloads are best placed. Using the workload placement feature, the platform will do all of this for you, moving virtual machines between hosts and clusters in your datacenter, you have the control to manually click to do this, or let the system do it automatically. Combining this will your business intent, the ability to adhere to SLAs and compliance for systems, you can ensure that workloads are moved to where the resources are available to serve them, but ensure, for example, Microsoft SQL workloads only run-on hosts inside of clusters where you have the appropriate licensing in place.
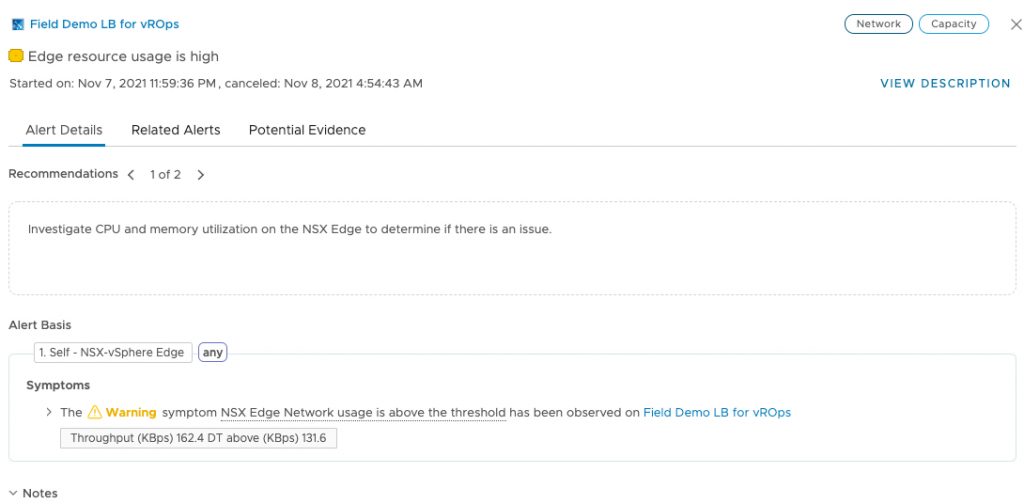
In most systems, you must manually and laboriously configure your alert for each specific use-case, then finger in the air guess at when the alert should be trigger.
“Is 20ms latency for my VMFS datastore too high? Should we alert when we hit at 18ms?”
Once the alert has triggered, how do you root-cause analysis (RCA) this? What if it is just simply your manual alerting threshold was too close to the baseline of your storage latency?
Introducing dynamic thresholds within vROPs means you can let the platform discover, analysis and adapt the alerts for you. Then as the system gathers more information, the better the results, or you can consume the output metrics yourself and make smarter decisions.

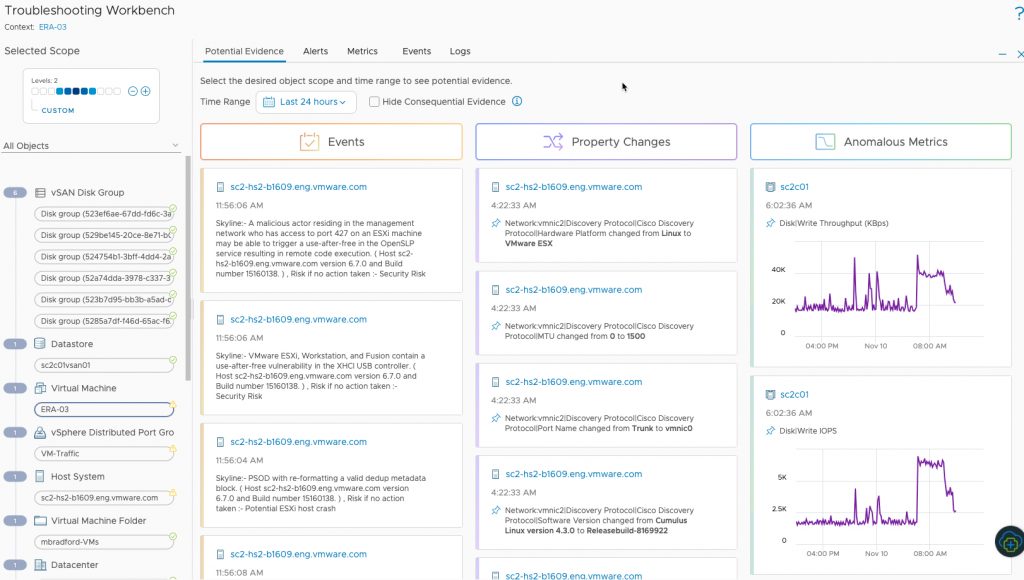
When it comes to root cause analysis (RCA), you can use one of our favorite features in vROPs today, the troubleshooting workbench. Just select the context you are interested in delving into, whether it be a virtual machine, an application, a container, storage volume, network switch or other. vROps will look at all the associated objects within the relationship of your context and display in a single screen all the property changes, metric changes from baseline thresholds and most importantly anomalous metrics.
Areas where vROps sees a change in the monitored platforms behavior that may be related the context you are viewing. This allows for quicker correlation between systems and making it easier to get the root of your issues.
No longer do you need to hunt around within different UI screens to get access to the data you need. (That option is still there under environment view within vROPs if you need it).

Now we have the data we need, either we’ve discovered it via the intuition of the troubleshooting workbench, or we’ve had an alert whereby the dynamic threshold has breached.
The action framework brings the ability to use out-of-the-box or define your own remediation policies. The ability to run workflows to remediate your issues in a click of a button. Let’s consider the following example:
An older heritage application that is no longer supported, you have 6 months left before you remove it from your environment, and it is replaced by a newer application
This application is troublesome, it has a memory leak that can’t be patched causing the service to crash every so often
Remediating this needs a level 2 or 3 engineer to SSH to the node and restart the service
With vRealize Operations, we can monitor the service through service discovery and application monitoring. If the service is reported as stopped, an alert is triggers. Attached to this alert is a workflow. The workflow will connect to the node and run the necessary commands, rather than human interaction.
This workflow can be run automation when the alert triggers, enabling you benefit from self-healing within your platform. The alerts will still be triggers and closed when the automated action is taken, and if you are integrating with a system such as ServiceNow, you can still follow your change management processes.
Alternatively, if you are not ready to implement automated actions, you can introduce approvals to these workflows being ran by your Service Users when an alert is triggered.

Hopefully this article has shown how powerful the vRealize Operations platform is for monitoring and management, whilst following an AIOps approach. Adopting the platform can drive dramatic improvements in productivity, it can reduce unplanned downtime by 90% and reduce the mean time to resolution of issues by 50%. For more information on the total economic impact of vRealize operations, please check out the Forrester study here.
Thanks for reading and check back soon for Part 4, where we’re talking about AI Cloud, for a self-tuning datacenter!
This post was co-authored with Dean Lewis, Senior Solution Engineer, VMware UK. Please check out Dean’s personal blog vEducate.co.uk or reach him on twitter @saintdle.


